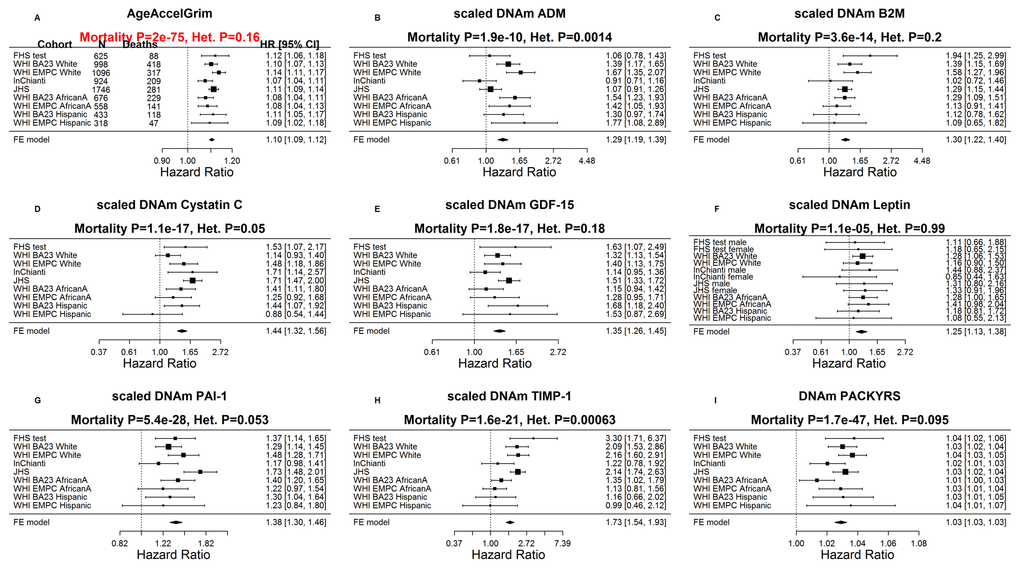
Figure 3.Meta analysis forest plots for predicting time-to-death due to all-cause mortality. Each panel reports a meta-analysis forest plot for combining hazard ratios predicting time-to-death based on a DNAm-based biomarker (reported in the figure heading) across different strata formed by racial group within cohort. (A) Results for AgeAccelGrim. Each row reports a hazard ratio (for time-to-death) and a 95% confidence interval resulting from a Cox regression model in each of 9 strata (defined by cohort and racial groups). Results for (age-adjusted) DNAm-based surrogate markers of (B) adrenomedullin (ADM), (C) beta-2 microglobulin (B2M), (D) cystatin C (Cystatin C), (E) growth differentiation factor 15 (GDF-15), (F) leptin, (G) plasminogen activation inhibitor 1 (PAI-1), (H) tissue inhibitor metalloproteinase 1 (TIMP-1) and (I) smoking pack-years (PACKYRS). The sub-title of each panel reports the meta-analysis p-value and a p-value for a test of heterogeneity Cochran Q test (Het.). (A) Each hazard ratio (HR) corresponds to a one-year increase in AgeAccelGrim. (B-H) Each hazard ratio corresponds to an increase in one-standard deviation. (I) Hazard ratios correspond to a 1 year increase in pack-years. The most significant meta-analysis P value (here AgeAccelGrim) is marked in red. A non-significant Cochran Q test p-value is desirable because it indicates that the hazard ratios do not differ significantly across the strata. For example, the hazard ratios associated with AgeAccelGrim exhibit insignificant heterogeneity across the strata (=0.16).