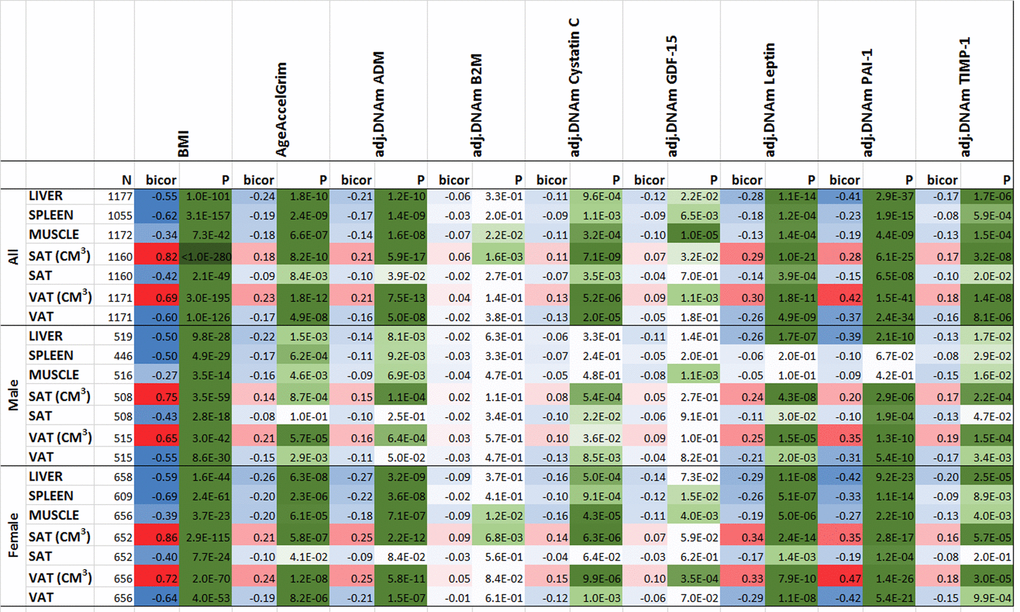
Figure 7.Computed tomography variables versus with body mass index and age-adjusted DNAm biomarkers in the FHS. The columns correspond to BMI, AgeAccelGrim and age-adjusted DNAm surrogates of plasma proteins. The rows correspond to computed tomography-derived organ density measures (Hounsfield units) or volumetric measures for subcutaneous adipose tissue (SAT CM3) or visceral adipose tissue (VAT CM3). The columns report the available sample size (n) in the FHS, the robust correlation coefficient (bicor, based on the biweight midcorrelation coefficient [62]). To avoid confounding by pedigree structure, we computed the p-value using a linear mixed effect model (pedigree as random effect). The bicor correlation coefficients are color-coded (blue to red) across its range of [-1, 1]. P-values are color-coded in green (light to dark green scale). We applied the correlation analysis to males and females, respectively, and then combined the results via fixed effect models weighted by inverse variance (listed in the top rows, denoted as “ALL”).