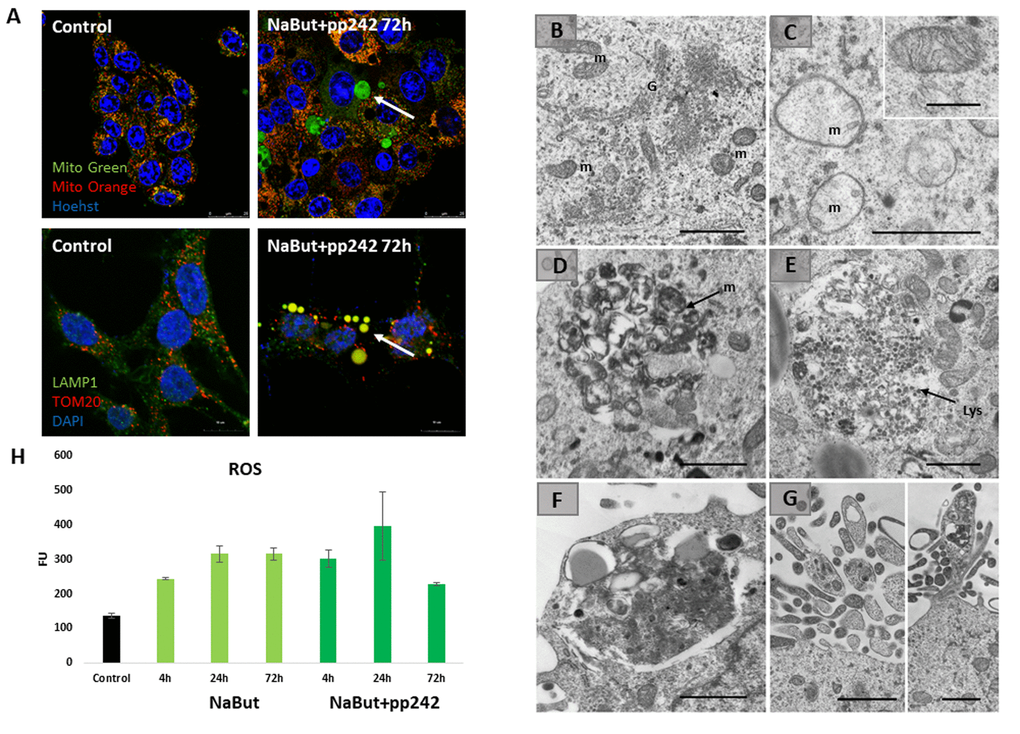
Figure 4.Senescent cells segregate damaged mitochondria into LC3-negative vacuoles after mTORC1 suppression. (A) IF images showing segregation of damaged mitochondria in the specific LC3-negative vacuoles in senescent cells exposed to mTOR inhibitor for 72 h. Upper panel: in vivo staining with Mitotracker Green and Mitotracker Orange visualized with the Leica TSC Microscope, 40x obj + zoom. Nuclei stained with Hoechst 33342. White arrow points the damaged mitochondria (Mitotracker Green only) inside of the vacuoles. Bottom panel: IF pictures after staining with antibodies against TOM20 and LAMP1 taken on the Olympus Fluoview 3000, 60x obj. Nuclei stained with DAPI. Arrow points the mitochondria colocalized with the lysosomes. (B) TEM image of senescent ERas cell with active mTORC1 (72 h) exhibiting the non-damaged mitochondria (m) and the enriched Golgi complex (G). (C) TEM image of senescent ERas cell treated with mTOR inhibitor pp242 for 72 h exhibiting the damaged mitochondria (m). Inset presents normal non-damaged mitochondria of untreated, non-senescent ERas cell. (D) Accumulation of membranous structures (mitochondria remnants, m) in the vacuole of senescent cell upon mTORC1 suppression. (E) Accumulation of lysosomes (Lys) in the vacuole of senescent cell upon mTOR suppression. (F) The vacuole containing lysosomes and membrane structure close to the plasma membrane of senescent ERas cell treated with mTOR inhibitor. (G) Membrane and electron-dense structures excreted from the cell. Scale bars in TEM images: 1 µm; inset (B) – 0,5 µm. (H) The level of reactive oxygen species (ROS) in senescent cells after 72 h of mTOR suppression measured using DCF-DA at proper wavelength.