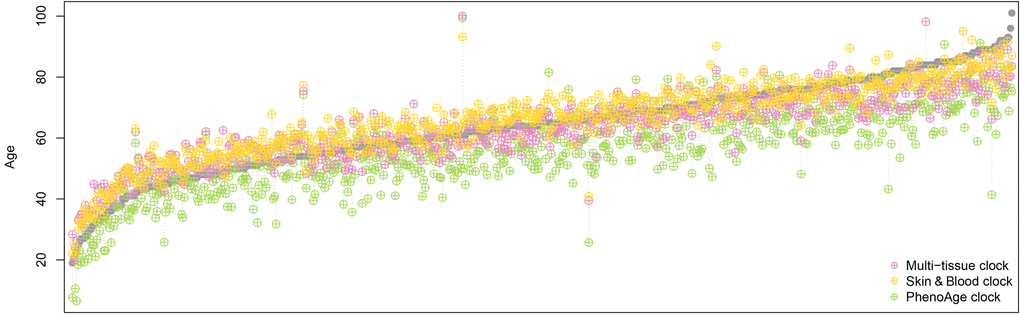
Figure 1.Comparison of epigenetic age estimations derived by three different epigenetic clocks. Each grey data point represents an individual whole blood sample, ordered by the chronological age of the sample donor from young to old. The coloured symbols show the epigenetic age estimation provided by the three clocks, where yellow represents the Skin & Blood clock, magenta the multi-tissue clock, and green the PhenoAge clock. The Skin & Blood clock’s age estimations come closest to the corresponding chronological ages. However, as the multi-tissue clock, it tends to show slightly increased epigenetic ages in younger individuals and decreased epigenetic ages in the elderly, while the PhenoAge clock predicts younger ages (in terms of life- and healthspan) for most individuals in the dataset used here [10]