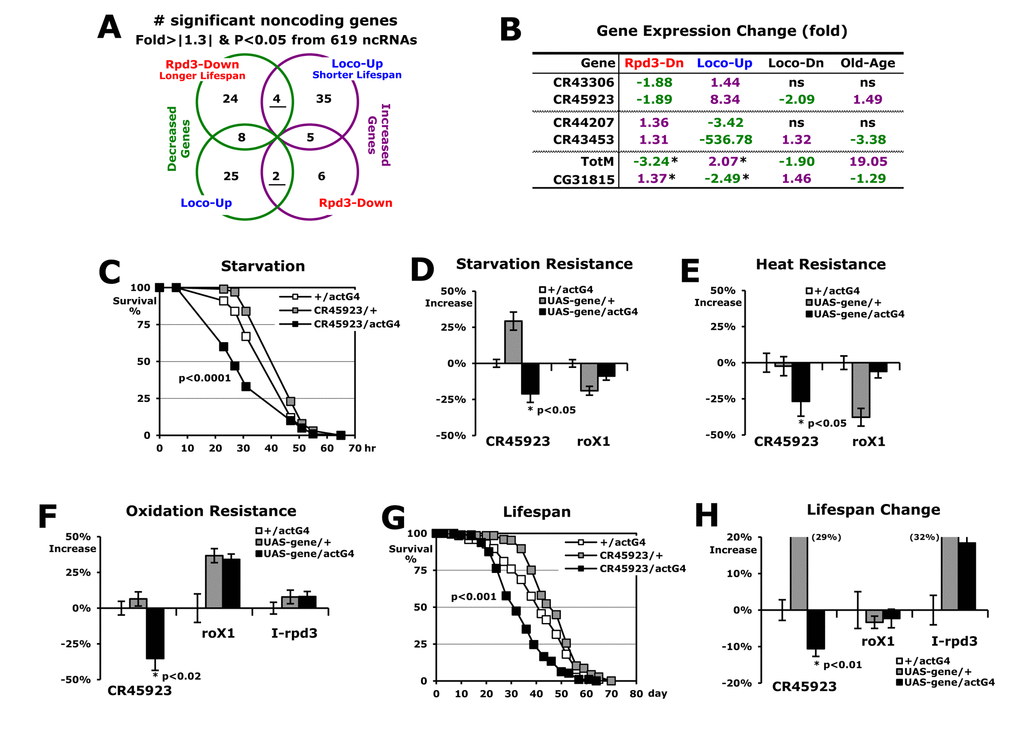
Figure 3.Noncoding RNAs related to the longevity of Rpd3 and Loco. (A) Expression analyses of the noncoding genes from RNA-seq experiments of Rpd3-Down or Loco-Up over the control. Among the genes with fold change > |1.3| and p-value < 0.05, the underline indicates that the expression decreases (green) and increases (purple) in each different group. (B) Expressional fold changes of selected genes with real-time PCR analyses (p-value < 0.02 ~ 0.0001). Loco-Dn: comparison between 2-day-old male flies of loco-/+ and wild-type (+/+); Old-Age: expression in the old flies (7 weeks) over young (1 week) flies between wild-type males; ns: non-specific change; *: expression changes of coding genes tested in Figure 2D. (C) The survival curve for starvation stress using 2-day-old male flies. P-value: log-rank test between the control (+/actG4) and CR45923/actG4 flies. (D-F) Stress resistance changes against starvation (D), heat (E), and oxidation (F). The percentages of median survival times changed from the +/actG4 flies (0%) are represented as average ± SEM followed by calculation of the median from several stress survival curves. P-value (*): Student’s t-test; I-rpd3: inverted sequence of rpd3. (G) The lifespan of adult male CR45923/actG4 flies with the controls (+/actG4 and CR45923/+). (H) Percent changes of mean lifespan are indicated as average ± SEM normalized by the +/actG4’s mean lifespan (39.3 ~ 42.8 days), which were calculated from several lifespan curves (G) of 3 ~ 5 independent experiments and were also tested with another driver tublin-Gal4. Parentheses: changed percentage out of data range in the graph.
Figure 3 — Longer lifespan in the Rpd3 and Loco signaling results from the reduced catabolism in young age with noncoding RNA | Aging