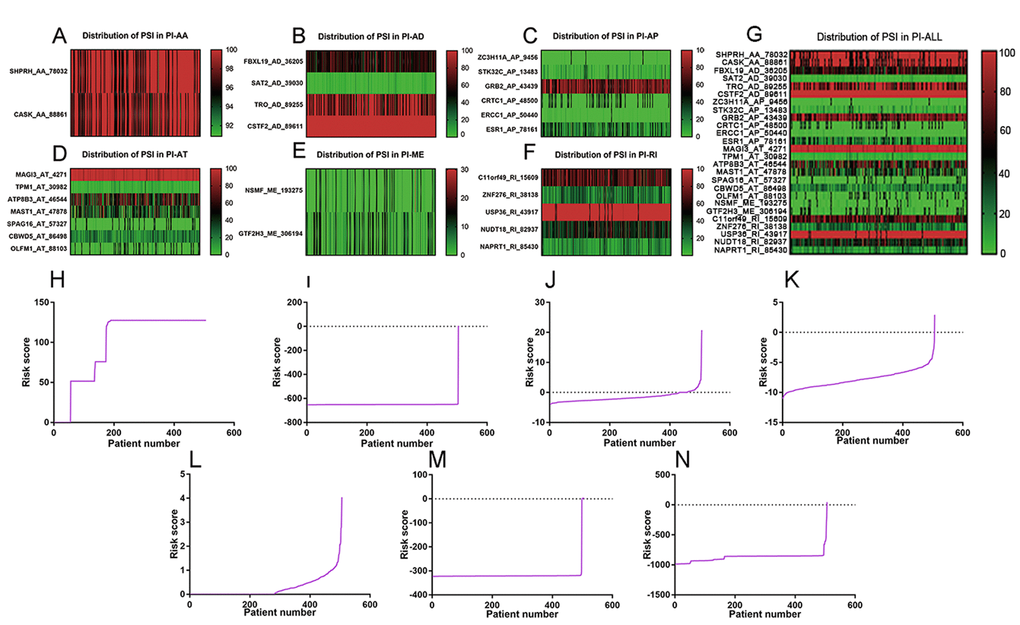
Figure 4.Distribution of PSI values and risk scores in each PI model. (A) distribution of PSI values in PI-AA model. (B) distribution of PSI values in PI-AD model. (C) distribution of PSI values in PI-AP model. (D) distribution of PSI values in PI-AT model. (E) Distribution of PSI values in PI-ME model. (F) Distribution of PSI values in PI-RI model. (G) Distribution of PSI values in PI-ALL model. The range of PSI values was annotated by a spectrum of colors from green to red; (H) Risk scores derived from significant survival-associated AS events in AA type. (I) Risk scores derived from significant survival-associated AS events in AD type. (J) Risk scores derived from significant survival-associated AS events in AP type. (K) Risk scores derived from significant survival-associated AS events in AT type. (L) Risk scores derived from significant survival-associated AS events in ME type. (M) Risk scores derived from significant survival-associated AS events in RI type. (N) Risk scores derived from significant survival-associated AS events in all types.