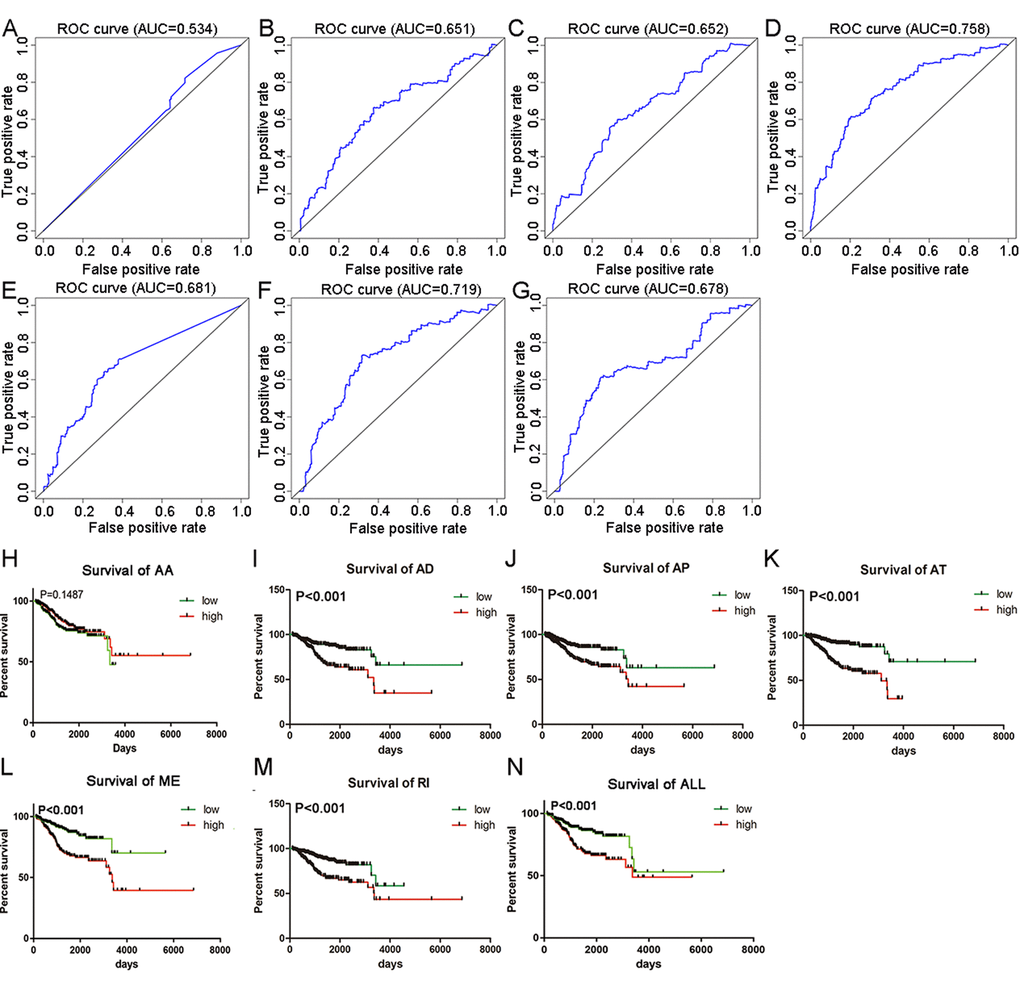
Figure 5.tROC curves and Kaplan-Meier survival curves seven PI models. (A) tROC curve for PI-AA model (AUC=0.534). (B) tROC curve for PI-AD model (AUC=0.651). (C) tROC curve for PI-AP model (AUC=0.652). (D) tROC curve for PI-AT model (AUC=0.758). (E) tROC curve for PI-ME model (AUC=0.681). (F) tROC curve for PI-RI model (AUC=0.719). (G) tROC curve for PI-ALL model (AUC=0.678). (H) Kaplan-Meier survival curves for PI-AA model (P=0.1487). Average OS time in low and high risk group was 2762 and 4713 days, respectively. (I) Kaplan-Meier survival curves for PI-AD model (P<0.001). Average OS time in low and high risk group was 5272 and 3219 days, respectively. (J) Kaplan-Meier survival curves for PI-AP model (P<0.001). Average OS time in low and high risk group was 5165 and 3469 days, respectively. (K) Kaplan-Meier survival curves for PI-AT model (P<0.001). Average OS time in low and high risk group was 5556 and 2511 days, respectively. (L) Kaplan-Meier survival curves for PI-ME model (P<0.001). Average OS time in low and high risk group was 4569 and 3848 days, respectively. (M) Kaplan-Meier survival curves for PI-RI model (P<0.001). Average OS time in low and high risk group was 3652 and 3957 days, respectively. (N) Kaplan-Meier survival curves for PI-ALL model (P<0.001). Average OS time in low and high risk group was 4787 and 3594 days, respectively.