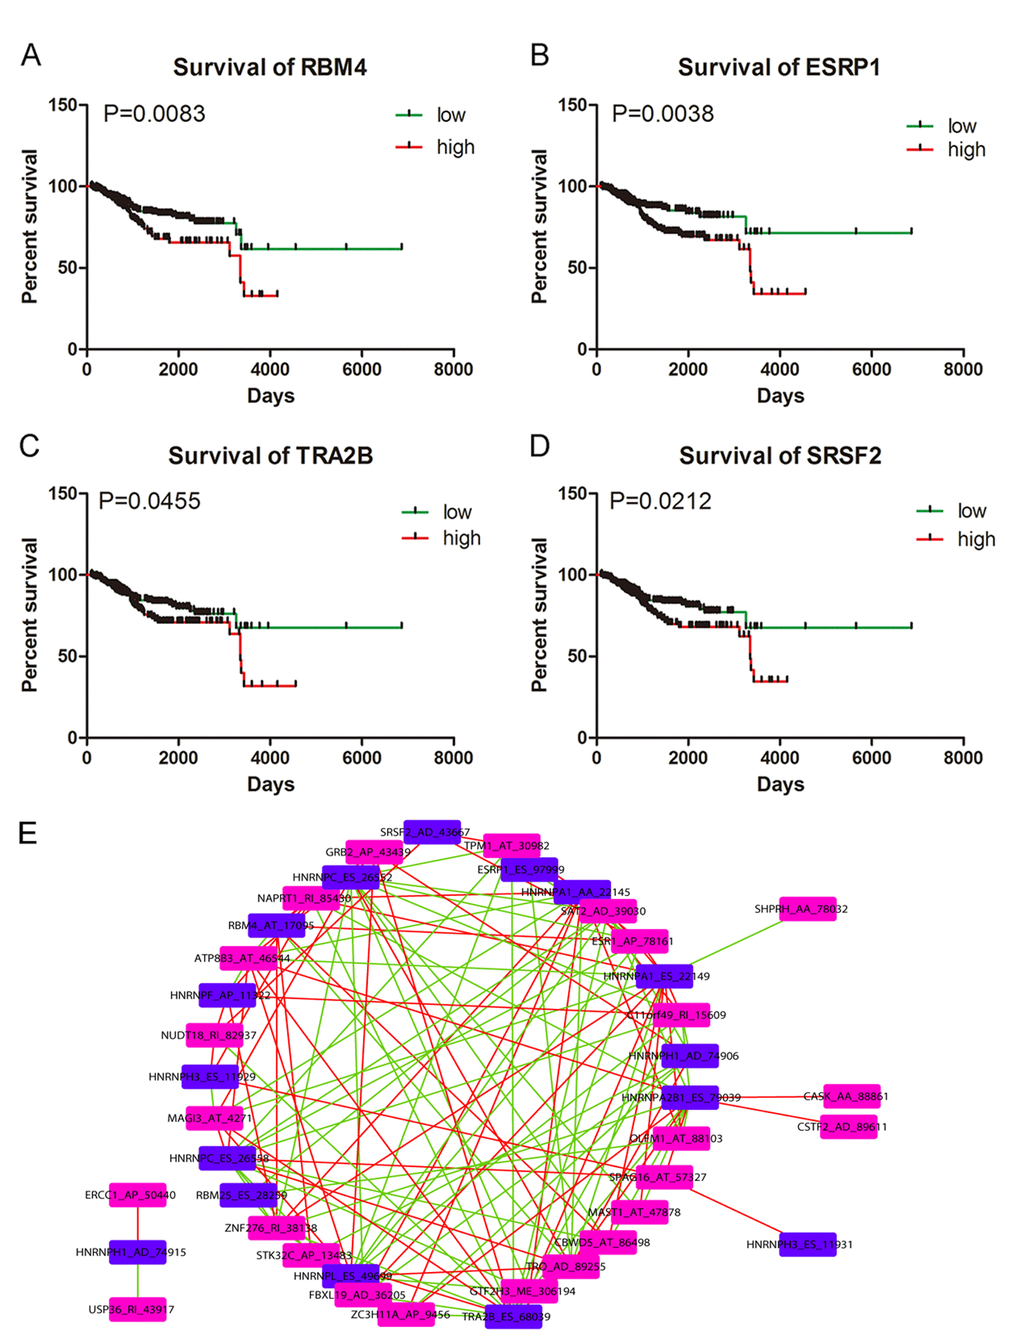
Figure 6.Kaplan-Meier survival curves for appraising the prognostic significance of splicing factors in UCEC and Correlation network. (A) Kaplan-Meier survival curves for RBM4 (P=0.0083). (B) Kaplan-Meier survival curves for ESRP1 (P=0.0038). (C) Kaplan-Meier survival curves for TRA2B (P=0.0455). (D) Kaplan-Meier survival curves for SRSF2 (P=0.0212). (E) Correlation network between splicing factor-related AS events and significant survival-associated AS events. Blue nodes (n=16) and purple nodes (n=24) represented splicing factor-related AS events and significant AS events from multivariate Cox regression analysis, respectively. Positive and negative correlations between splicing events were marked as red lines (n=68) and green lines (n=64), respectively.