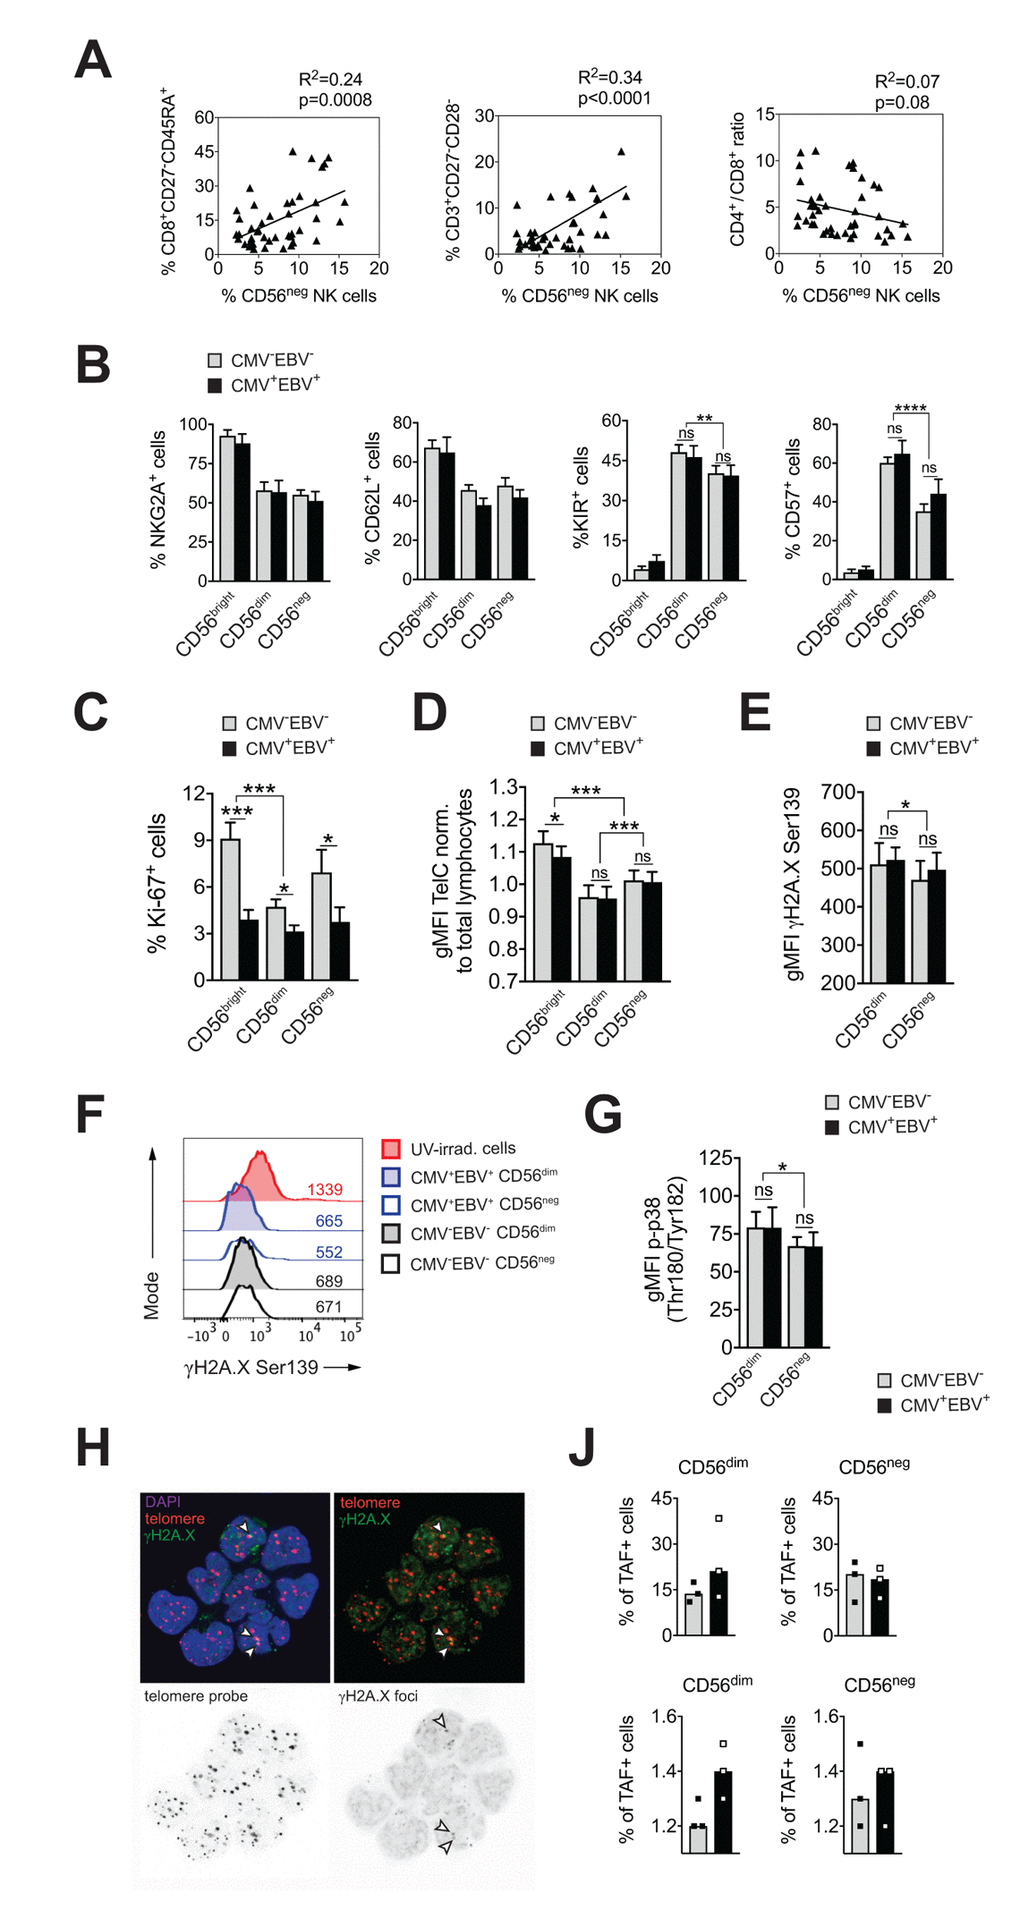
Figure 2.CD56neg NK cells do not acquire cell senescence characteristics. (A) Frequencies of CD56neg NK cells in relation to CD8+ EMRA T cells (left panel), CD27-CD28- T cells (middle panel) and the CD4 / CD8 T cell ratio (right panel) as assessed by FACS analysis in total PBMCs (n=53/55). Data were analyzed by linear regression: correlation strength (R2) and statistical significance (p-value) are indicated for each scatter plot. (B) The differentiation stage of CD56neg NK cells was assessed by FACS analysis for NKG2A, CD62L, KIR and CD57 expression in total PBMCs. CD56neg NK cells were compared to CD56bright and CD56dim NK cells from CMV–EBV– (gray bars, n=10/11) and CMV+EBV+ donors (black bars, n=10/14). (C) Proliferation of NK cell subsets from CMV–EBV– (gray bars, n=10/11) and CMV+EBV+ (black bars, n=10/14) donors as assessed directly ex vivo by FACS analysis for Ki-67 expression. (D) Telomere length of NK cell subsets in CMV–EBV– (gray bars, n=10/10) and CMV+EBV+ donors (black bars, n=10/14) as assessed by FACS-based FISH-technique. Data are shown as geometric mean of fluorescence intensity (gMFI) of the telomere probe (TelC), normalized to the gMFI TelC value of the total lymphocyte population for each donor. (E) Global phosphorylation of the histone H2A.X (γH2A.X Ser139) in CD56dim and CD56neg NK cells in CMV–EBV– (gray bars, n=8/11) and CMV+EBV+ donors (black bars, n=9/14) as assessed directly ex vivo by FACS analysis. (F) Representative histograms for γH2A.X staining in a CMV–EBV– (gray histograms) and CMV+EBV+ (blue histograms) donor. UV-irradiated PBMCs served as positive control. (G) Phosphorylation of p38-MAPK Thr180/Tyr182 in CD56dim and CD56neg NK cells in CMV–EBV– (gray bars, n=8/11) and CMV+EBV+ (black bars, n=9/14) donors analyzed directly ex vivo by FACS analysis. (H) Representative telomere fluorescence in situ hybridization images showing overlay images of the nuclear staining (DAPI, purple) with telomere probe (red) and γH2A.X Ser139 (green) (top left) and co-localization of telomere probe and γH2A.X foci = telomere-associated fluorescence (TAF) (top right panel). White arrows indicate TAF. Greyscale stack images of the telomere probe (bottom left) and γH2A.X foci are shown (bottom right). (J) Cumulative data from CMV–EBV– (gray bars, n=3) and CMV+EBV+ (black bars, n=3) donors are shown analyzed as in (H). Top panel shows the frequency of TAF+ cells, bottom panel the number of TAF / TAF+ cell in CD56dim and CD56neg NK cells. (A-G) Experiments were performed on total PBMCs. (H, J) Experiments were performed on FACS-sorted CD56dim and CD56neg NK cells. For parametric data mean ± SEM, for non-parametric data median ± IQR are shown. * p≤0.05, ** p≤0.005, *** p≤0.005, **** p≤0.0005, ns=not significant.