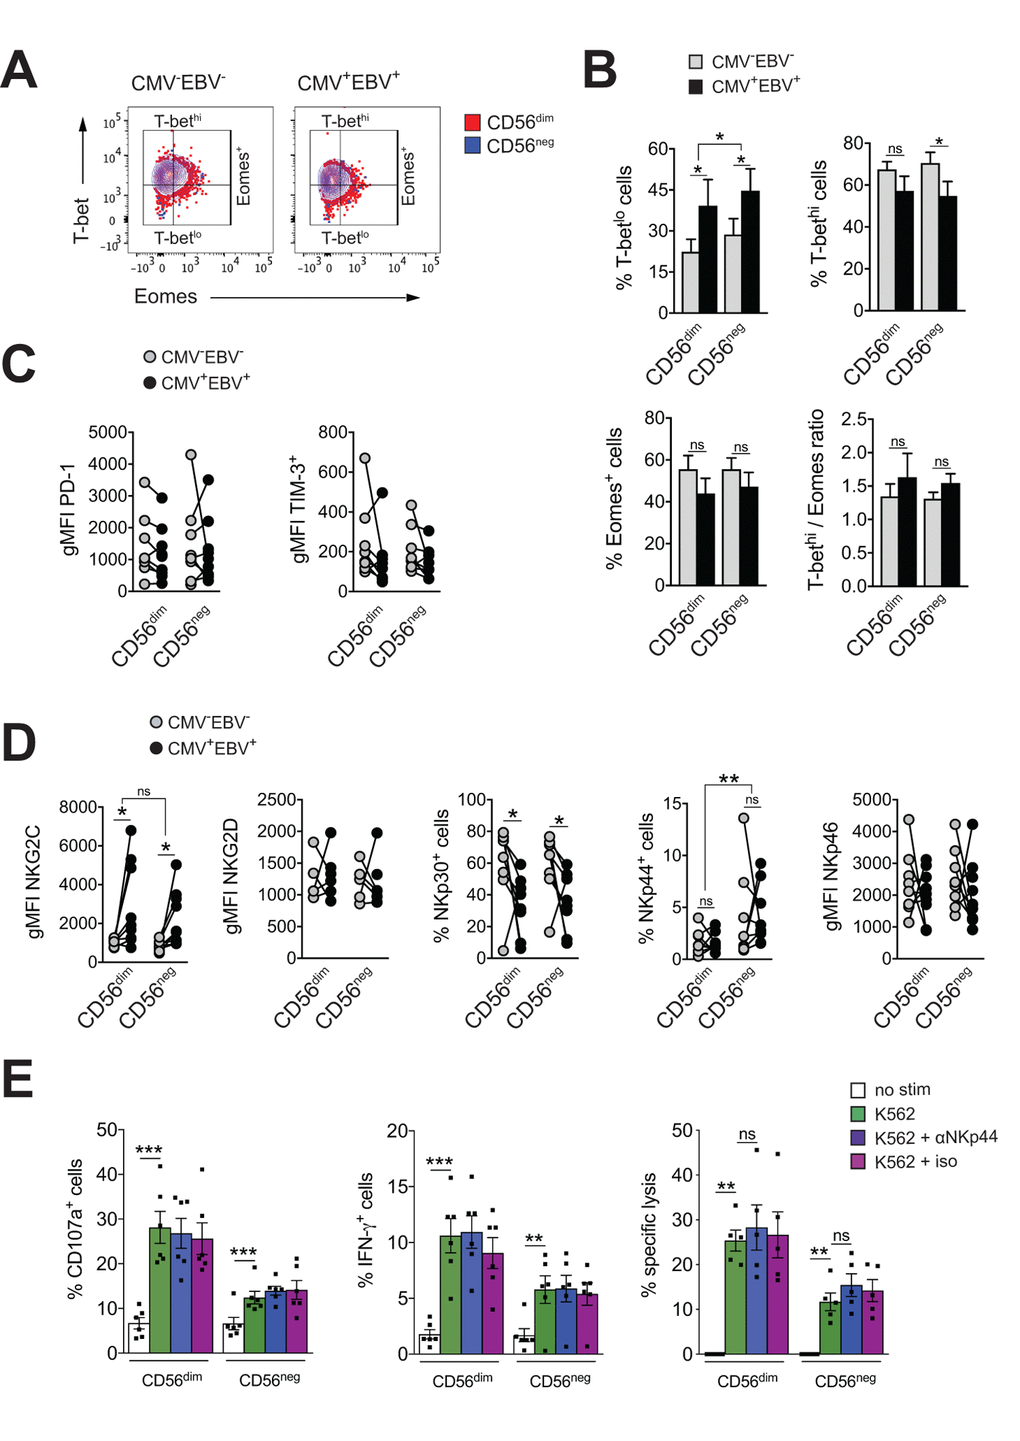
Figure 3.CD56neg NK cells lack features of exhausted cells. (A) Overlay contour plot analysis comparing T-bet and Eomes expression in CD56dim (red) and CD56neg (blue) NK cells from a representative CMV–EBV– (left panel) and CMV+EBV+ (right panel) donor. Gating strategy for T-bet-high (T-bethi), T-bet-low (T-betlo) and Eomes-positive (Eomes+) cells is indicated. (B) The percentage of T-betlo, T-bethi and Eomes+ cells, as well as the T-bet / Eomes ratio (Tbethi / Eomes+) are shown in CD56dim versus CD56neg NK cells from CMV–EBV– (gray bars, n=8/11) and CMV+EBV+ (black bars, n=8/14) donors analyzed as in (A). (C) PD1- and TIM-3 expression on CD56dim and CD56neg NK cells from CMV–EBV– (gray circles, n=8/11) compared to CMV+EBV+ (black circles, n=9/14) donors. (D) Cell surface expression of activating NK cell receptors NKG2C and NKG2D and natural cytotoxicity receptors NKp30, NKp44 and NKp46 on CD56dim and CD56neg NK cells from CMV–EBV– (gray circles, n=8/11) compared to CMV+EBV+ (black circles, n=9/14) donors. (C, D) Values are expressed as gMFI for unimodal data, and as % of positive cells for bimodal data. (E) FACS-sorted CD56dim and CD56neg NK cells were either left un-stimulated (empty bars), stimulated with K562 cells alone (green bars) or K562 cells and a blocking NKp44 monoclonal antibody (blue bars) or an isotype control (purple bars), respectively, and expression of CD107a, IFN-γ and target cell lysis was assessed as described. Experiments were performed on total PBMCs in (A-D) and on FACS-sorted CD56dim and CD56neg NK cells in (E). For parametric data mean ± SEM, for non-parametric data median ± IQR are shown. Data were analyzed by Student’s t-test and Mann-Whitney test, respectively. * p≤0.05, ** p≤0.005, *** p≤0.005, ns=not significant.