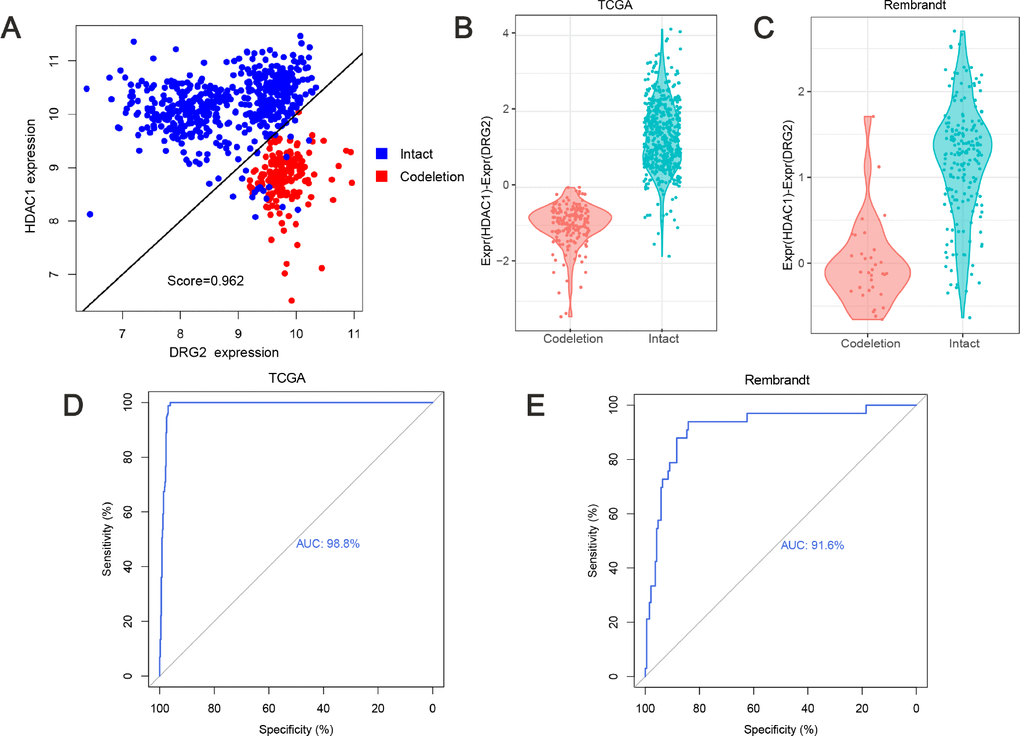
Figure 1.Predicting 1p/19q status by TSPair algorithm. (A) HDAC1 and DRG2 pair was the top scoring pair in predicting 1p/19q (score=0.962). The expression values of training set were normalized as Expr=log2(RSEM+1). (B) the values (HDAC1 - DRG2 expression values) were significantly different (p=0.0063) between 1p/19q co-deleted group and intact group in TCGA cohort. (C) the values (HDAC1 - DRG2 expression values) were significantly different (p<0.0001) between 1p/19q co-deleted group and intact group in Rembrandt cohort. (D and E) ROC curve for 1p/19q status prediction in TCGA cohort and Rembrandt cohort, AUC=0.988 and 0.916, respectively.