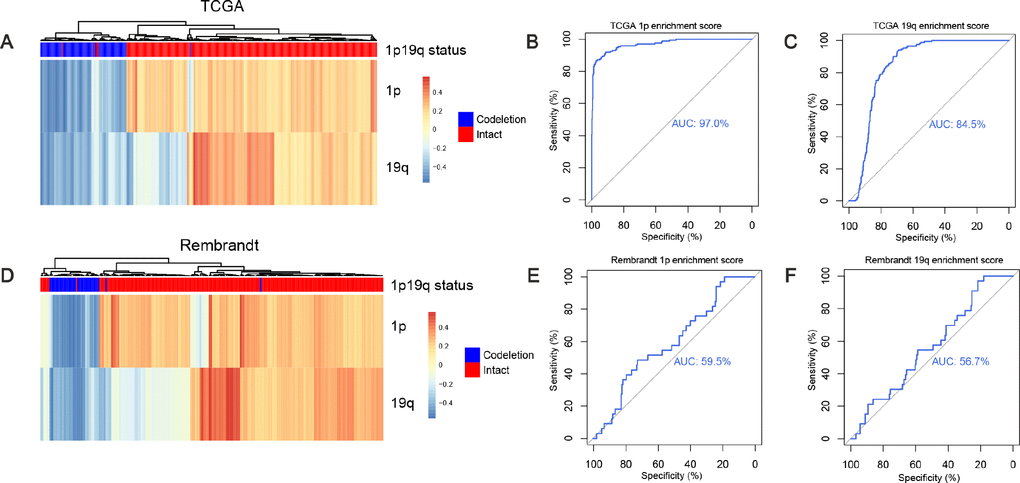
Figure 2.Predicting 1p/19q status by GSVA algorithm. (A and D) the hierarchical clustering of TCGA and Rembrandt cohorts based on the enrichment scores of 1p and 19q genes, respectively. (B, E) ROC for 1p/19q status prediction by 1p genes enrichment scores, AUC (TCGA cohort) = 0.970, AUC (Rembrandt cohort) = 0.595. (C, F) ROC for 1p/19q status prediction by 19q genes enrichment scores, AUC (TCGA cohort) = 0.845. AUC (Rembrandt cohort) = 0.567.