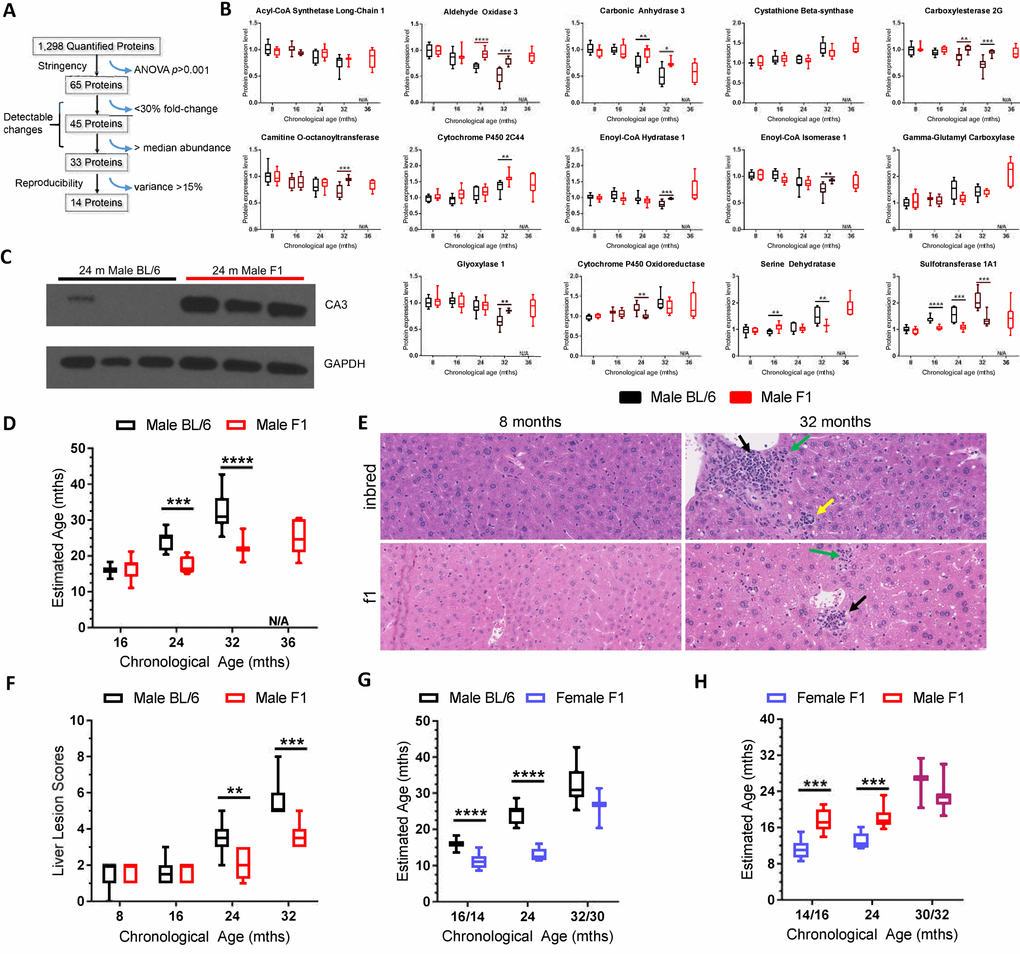
Figure 2.Selection of the biological age calculator protein panel and its application to other strains of wild-type mice. (A) Illustration of how the 14 protein panel was selected from the 1,298 proteins that were quantified in liver of C57BL/6Jnia mice. 65 proteins had a one-way ANOVA p<0.001, providing high statistical significance in age-related changes in expression. 45 of those proteins had a fold-change difference of ≥30% and 33 of those had abundance above the median, facilitating detection of expression changes. 14 of those 33 proteins had a maximal intragroup variance of 15%, supporting reproducibility. (B) Expression of the 14 proteins selected for the biological age calculator in male C57BL/6J mouse liver (black) and male f1a mouse liver (red) at multiple ages. (C) Immunoblot detection of carbonic anhydrase 3 expression in liver from three 24 month-old inbred and three f1a mice. The tissue lysates used were the same as those used in the MS experiments, providing intra-experimental validation. (D) The combined expression data from the panel of 14 proteins sets the biological (estimated) age to the chronological age for the reference group of mice, C57BL/6Jnia (i.e., the black bars define 16, 24 and 32 months according to the biological age calculator; see methods for more details). Red bars represent the summation of the data on the same 14 proteins in male f1a mice estimating their biological age at the chronological ages of 8, 16, 24, and 32 months relative to the reference strain. (E) Representative images of liver sections from male inbred (C57BL/6Jnia) and f1a (C57BL6/Jnia:Balb/cBy) mice at two ages. The older mice show numerous age-related lesions consisting of portal inflammation (green arrows), portal duct hyperplasia (yellow), microgranulomas (black) and mild intermittent hepatic degeneration. The inbred mice had more extensive age-related lesions than the f1a mice. (F) The composite lesion score reflects the incidence and severity of a specific panel of age-related liver lesions and was used as a separate calculator of biological age, in the same C57BL/6Jnia (black) and f1a (red) male mice used for proteomic analysis. (G) Same as (D) but for female mice of a different f1b strain (blue). The female mice were analyzed at 14 rather than 16 months of age and 30 vs. 32 months of age (x-axis). (H) Estimated biological age of f1b female (blue) vs. f1a male mice (red). Significance testing for all panels using Student’s unpaired, equal variance t-test, error bars show SEM. *p<0.05, **p<0.01, ***p<0.001, ****p< 0.0001; N/A, not applicable.