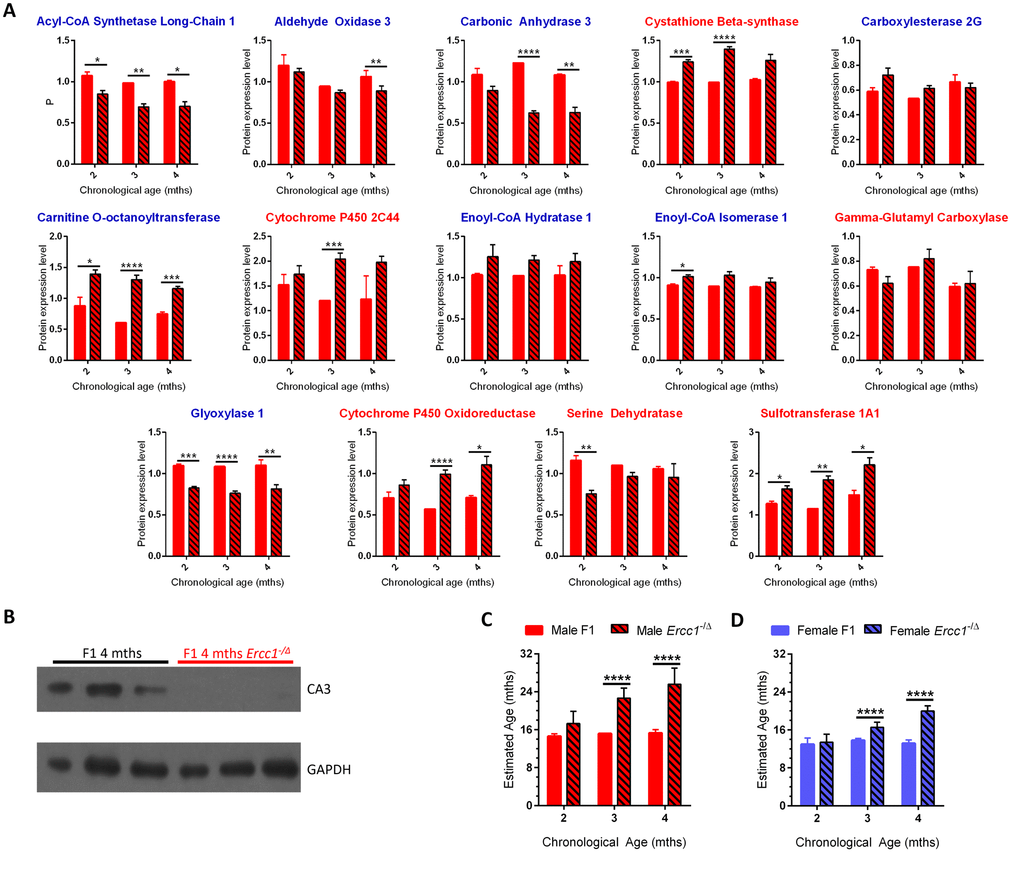
Figure 3.Using the age calculator to determine the biological age of progeroid Ercc1-/Δ mice. (A) Expression of the 14 proteins selected for the biological age calculator in male f1 Ercc1-/Δ mouse liver (hatched bars) compared to age-matched f1 male mice (solid red) at 3 ages. The proteins with blue titles decreased significantly in expression with chronological age of wild-type mice, while those with red titles increased significantly with aging in WT mice (Figure 2). Error bars show SEM. *p<0.05, **p<0.01, ***p<0.001, ****p< 0.0001. (B) Immunoblot validation of reduced expression of carbonic anhydrase 3 in liver of progeroid Ercc1-/Δ mouse liver compared to wild-type littermates. Tissue samples were from mice distinct from the MS experiment, providing inter-experimental validation. (C) Estimated biological age of male f1 WT (red bars) and Ercc1-/Δ (hatched bars) mice at three ages (x-axis) compared to the age of male inbred mice (y-axis). (D) Estimated biological age of female f1 WT (blue bars) and Ercc1-/Δ (hatched bars) mice at three ages (x-axis) compared to the age of male inbred mice (y-axis). Significance testing for all panels using Student’s unpaired, equal variance t-test, error bars show SEM, ****p< 0.0001.
Figure 3 — Measuring biological age in mice using differential mass spectrometry | Aging