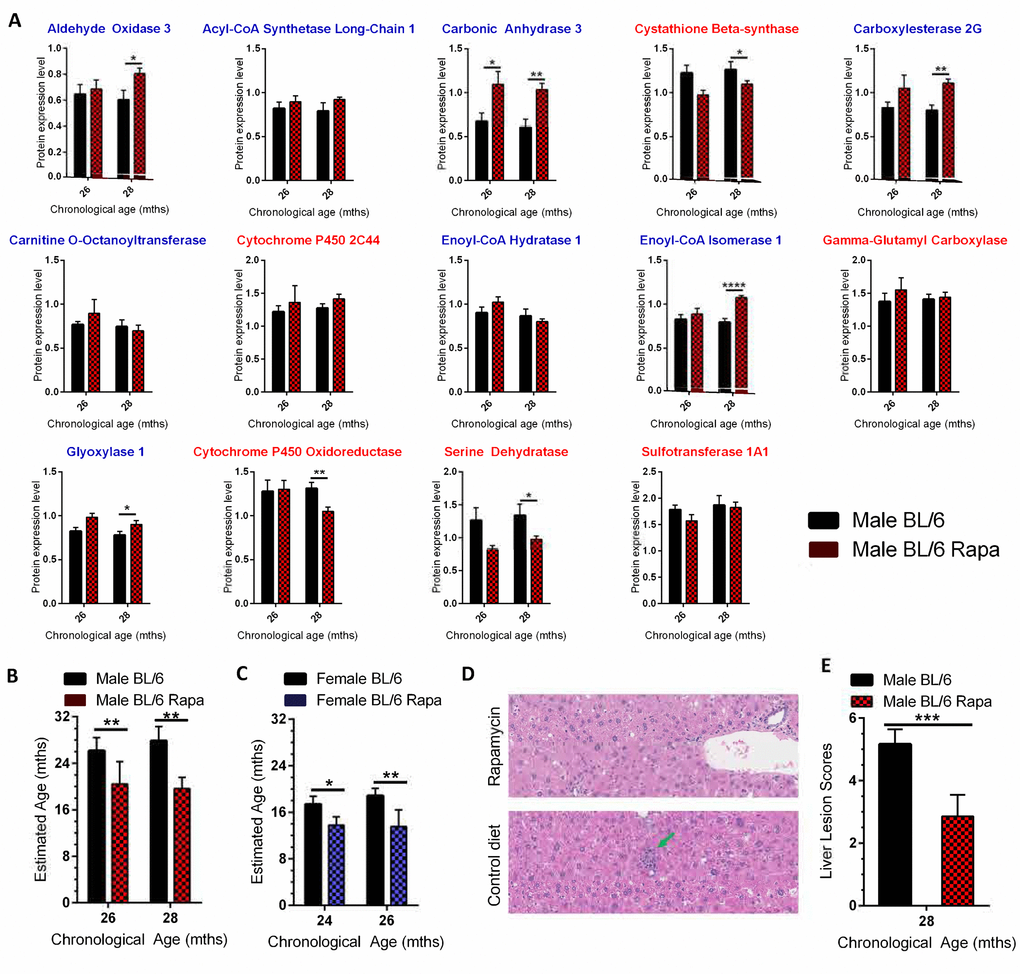
Figure 4.Using the age calculator to determine the biological age of WT mice treated with the anti-geronic factor rapamycin. (A) Expression of the 14 proteins selected for the biological age calculator in livers of C57BL/6NJ male mice put on a diet containing 42 ppm rapamycin starting at 24 months for 8 weeks (26 month data, red checked bars) or 16 weeks (28 month data, red checked bars) or mice fed a control diet (black bars). The proteins with blue titles above the graph decreased significantly in expression with age in C57BL/6NJ mice, while those with red titles increased significantly (Figure 2). (B) Estimated biological age for male C57BL/6NJ mice fed the rapamycin diet (red checked bars, 26 and 28 months represent 8 and 16 week treatment, respectively) relative to isogenic male mice fed a control diet (black bars). (C) Estimated biological age for female C57BL/6NJ mice fed the rapamycin diet (14 ppm; blue checked bars) relative to isogenic female mice fed a control diet (black bars) using C57BL/6NJ male mice as the reference (y-axis scale). (D) Representative images of liver sections from male C57BL/6NJ mice ± treatment with rapamycin. There was a lack of progression of age-related lesions (arrows) in the rapamycin-treated mice compared to mice on the control diet. Lesions consist of microgranuloma (green arrow) and mild intermittent hepatic degeneration. (E) The composite lesion score, reflecting the incidence and severity of a specific panel of age-related liver lesions in the rapamycin-treated male mice compared to isogenic mice on a control diet. Significance testing for all panels using Student’s unpaired, equal variance t-test, error bars show SEM. *p<0.05, **p<0.01, ***p<0.001, ****p< 0.0001.
Figure 4 — Measuring biological age in mice using differential mass spectrometry | Aging