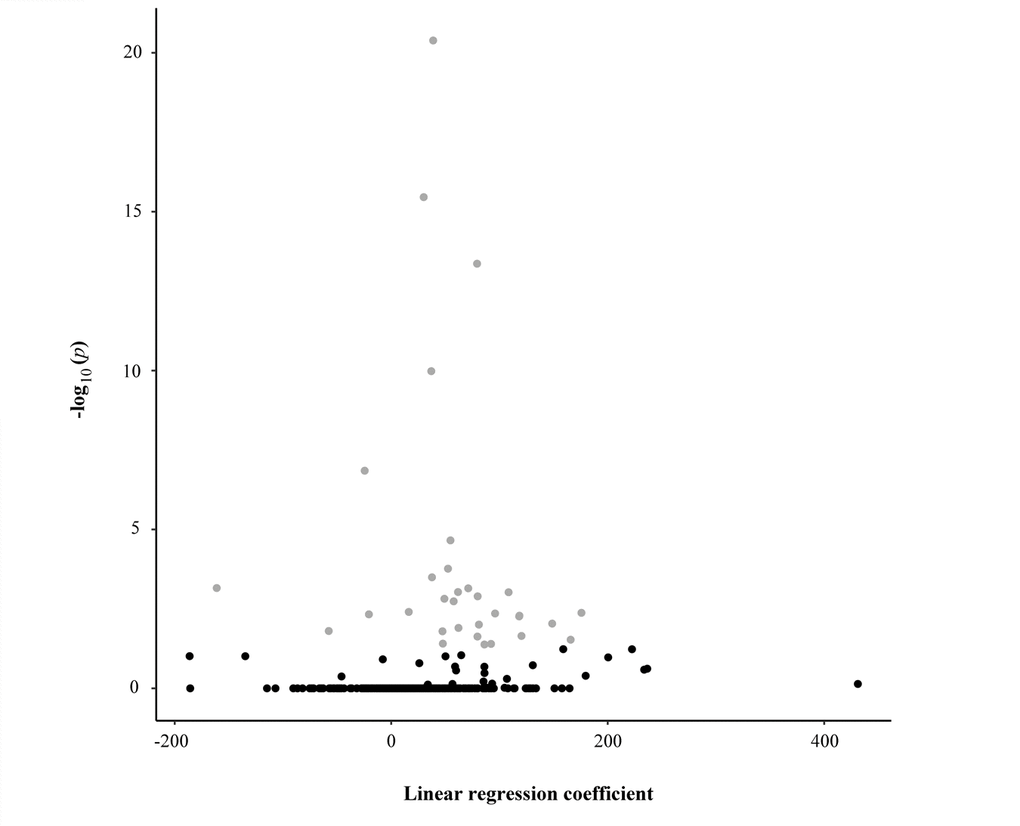
Figure 1.Scatter plot reporting the linear regression coefficients (x-axis) and the corresponding -log10 adjusted p-values (y-axis) of the association between each CpG unit and the age of the study sample. Each dot represents one CpG unit. Grey dots indicate CpG units whose levels were significantly associated with the age of the study sample.