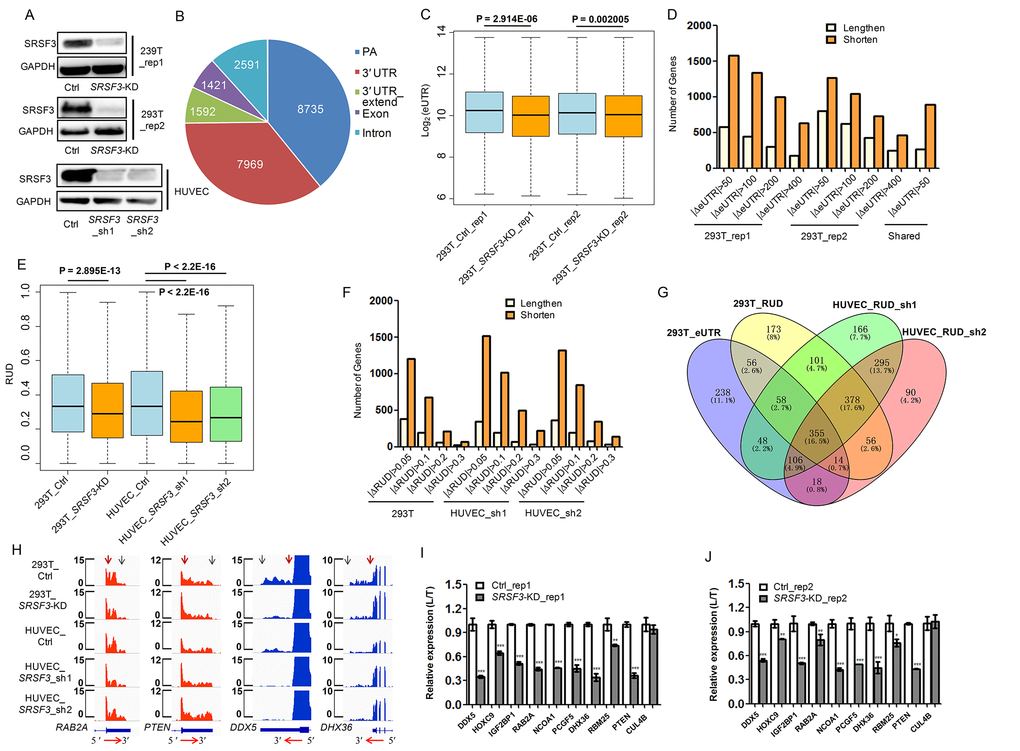
Figure 1.SRSF3 downregulation leads to global shortening of 3′ UTR in human cells. (A) Western blot confirmed lentivirus-mediated RNA interference in both human 293T and HUVEC cells. GAPDH served as internal loading control. (B) Genomic distribution of pA sites identified in 293T cells based on PA-seq method. (C) Box plot of log2-transformed eUTR based on PA-seq in control and SRSF3-KD 293T cells. The P value of t-test is shown. (D) Histogram of gene numbers with 3′ UTR shortening or lengthening upon SRSF3 KD at different cutoffs and overlapped genes with shortened 3′ UTR (with the cutoff of |ΔeUTR| > 50) between two biological replicates in 293T cells. |ΔeUTR| > 50, 100, 200 and 400 represent the absolute difference of eUTR between SRSF3-KD and control 293T cells, respectively. Number of shared genes (labelled Shared) between two biological replicates were also shown. (E) Box plot of RUD in 293T and HUVEC cells upon knockdown of SRSF3. (F) Histogram of gene numbers with 3′ UTR shortening or lengthening upon SRSF3 KD at different ΔRUD cutoffs. |ΔRUD| > 0.05, 0.1, 0.2 and 0.3 each represents a threshold of absolute difference of RUD between SRSF3-KD and control human cells. (G) Venn diagram of genes with shortened 3′ UTR based on different methods (eUTR and RUD), different shRNAs (sh1 and sh2) and different cells (293T and HUVEV) (ΔRUD ≤ -0.05) upon knockdown of SRSF3. (H) RNA-seq tracks of four representative genes in two human cell types upon SRSF3 KD. The transcription direction is shown at the bottom. The vertical red and blue arrows represent the proximal and distal pA sites, respectively. Y axis denotes the normalized read coverage. (I, J) qRT-PCR validation of the usage of longer 3′ UTR in the total expression (L/T) in both control and SRSF3-KD 293T cells of two biological replicates (rep1 in I and rep2 in J). Rep1 and rep2 represent two biological replicates, and sh1 and sh2 denote two different shRNAs. ** and *** mean P value less than 0.01 and 0.001 (t-test), respectively.