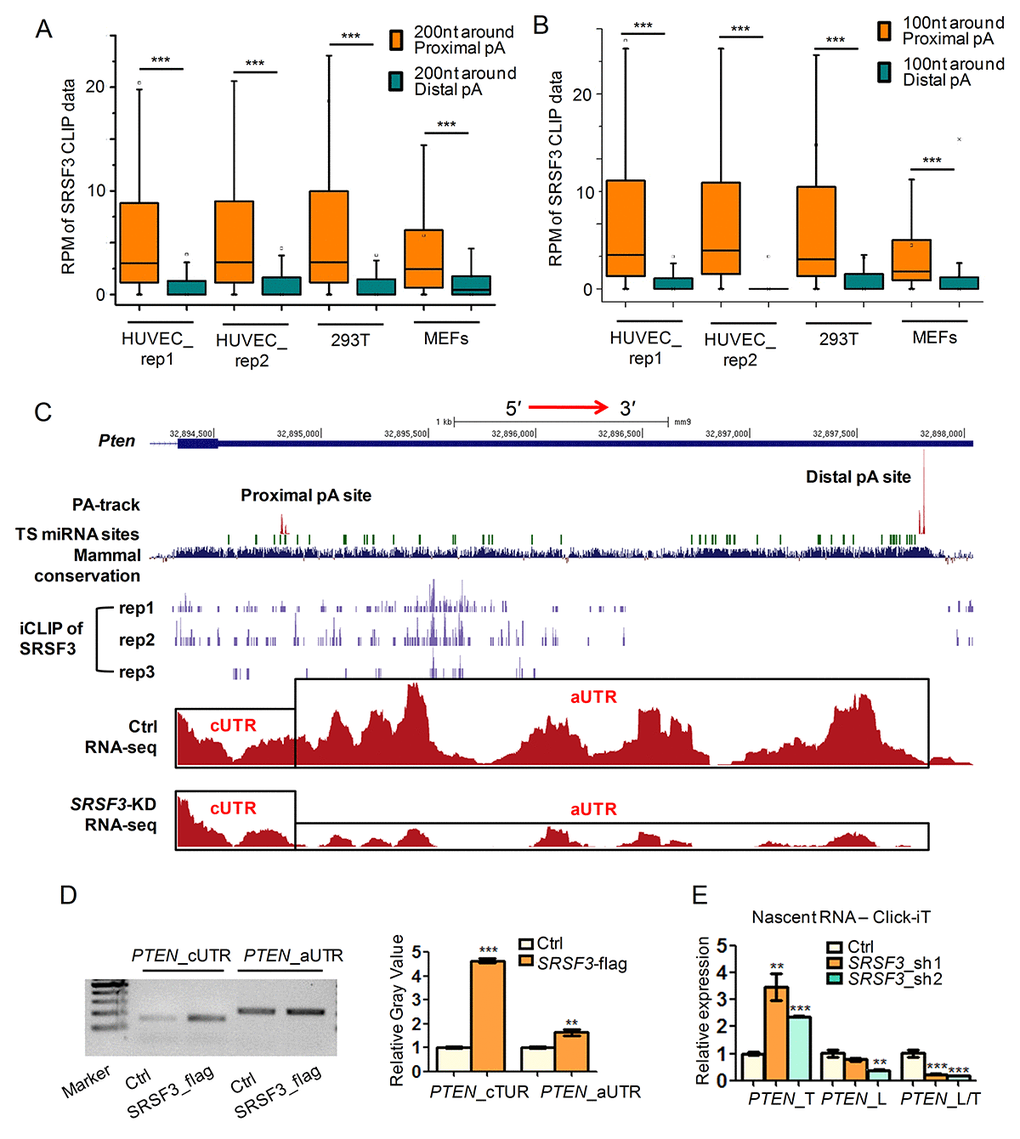
Figure 2.SRSF3 favors binding proximal pA sites and modulates APA at transcriptional level. (A-B) Box plots of public available human and mouse CLIP-seq data of SRSF3 in 3′ UTR shortened genes. Y axis represents the normalized tag intensity (reflected by RPM, reads per million) within 200 nt (A) or 100 nt (B) around the proximal and distal pA sites. Rep1 and rep2 means two biological replicates of HUVEC cells. (C) A combinated UCSC genome view near the 3′ UTR of mouse Pten containing PA-seq track, TargetScan predicted microRNA binding sties (TS miRNA sites), Mammal conservation score, SRSF3 iCLIP track (three replicates), RNA-seq track of control (Ctrl) and SRSF3-KD cells . cUTR and aUTR represent the common and alternative 3′ UTR of Pten, respectively. (D) Semi-quantitative RIP-PCR using cUTR or aUTR specific primer for PTEN on immunoprecipitated products separately harvested by anti-flag (SRSF3_flag) and IgG (Ctrl). IgG served as background binding (Ctrl). Left panel denotes the gel image while right panel represents the relative gray value quantified by imageJ software. (E) qRT-PCR quantifying the nascent RNA isolated by using the Click-iT kit in SRSF3-KD (sh1 and sh2) and control (Ctrl) 293T cells. PTEN_T, PTEN_L and PTEN_L/T represent total expression (short plus long 3′ UTR), expression of long 3′ UTR and relative expression ratio of long 3′ UTR compared to total expression, respectively. *, ** and *** mean P value less than 0.05, 0.01 and 0.001 (t-test), respectively.