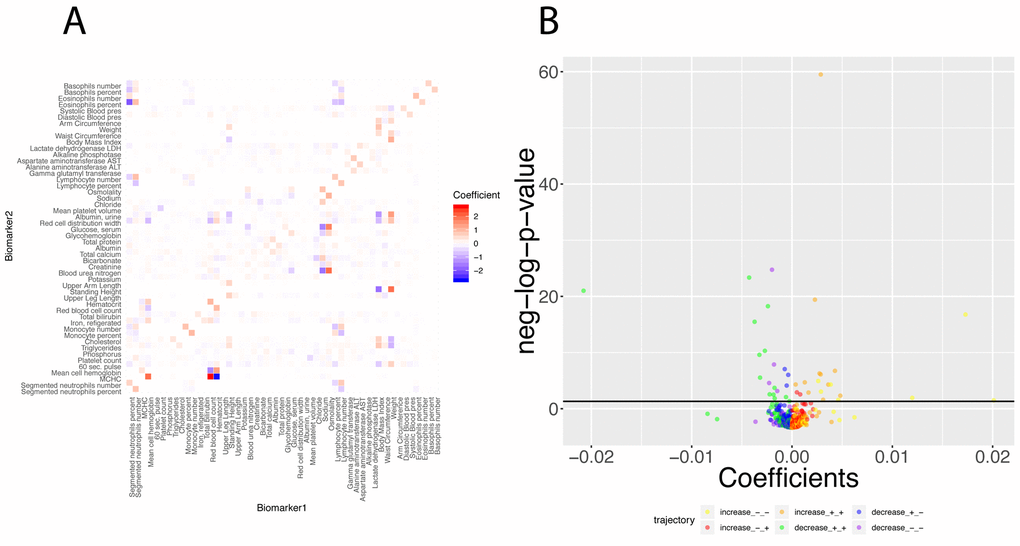
Figure 12.Regression coefficients: Baseline regression coefficients for the prediction of the 50 biomarkers and significance of their changes with age. (A) Heatmap of the regression coefficients on the full cohort. Each column corresponds to the 49 coefficients used to predict the values for one of the 50 biomarkers. (B) Volcano plot of the changes of the regression coefficients with age.The black horizontal line corresponds to the 0.05 significant threshold, after Bonferroni correction. The green dots are coefficients that decrease with age but remain positive. The blue dots are coefficients that decrease with age, starting positive and ending negative. The purple dots are coefficients that decrease with age and remain negative. The yellow plots are coefficients that increase with age but remain negative. The red dots are coefficients that increase with age, starting negative and ending positive. The orange dots are coefficients that increase with age and remain positive.