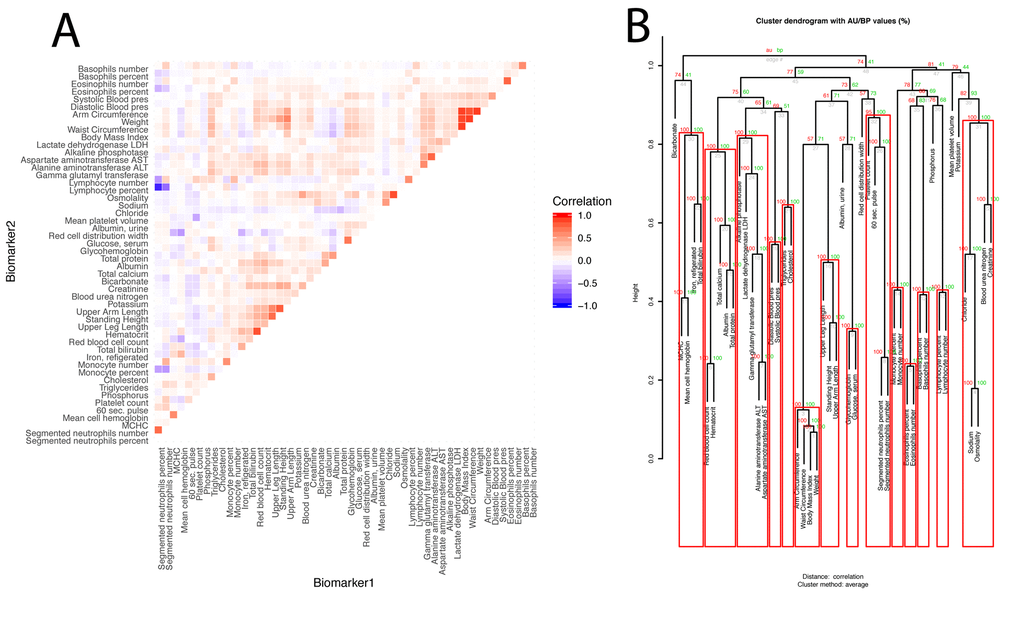
Figure 3.Baseline correlation structure of the biomarkers. (A) Correlation matrix of the biomarkers.The biomarkers are ordered based on their clustering. Red is associated with a positive correlation, blue with a negative correlation. (B) Hierarchical clustering of the biomarkers. For each cluster, the number in green is the bootstrap probability (BP)--the percentage of bootstraps in which the cluster was present. The number in red is called the approximated-unbiased p-value (AU). AU is a better estimation of the unbiased p-value than BP, and the red boxes circle the significant clusters, based on this criterion, with alpha=0.95 (a cluster is marked as significant if its AU is greater than 95). The number in grey is the rank of the cluster, low numbers means the clustering happened early in the process. The height is the measure of the proximity between the two clusters being merged. The height is one minus the mean correlation between the two clusters, so two perfectly correlated biomarkers/clusters cluster at height zero, and two perfectly uncorrelated biomarkers/clusters cluster at height one. The first column compares males and females, the second column compares non-Hispanic Whites and Hispanics, the third column compares non-Hispanic Whites and non-Hispanic Blacks, and the fourth column compares the two control groups.