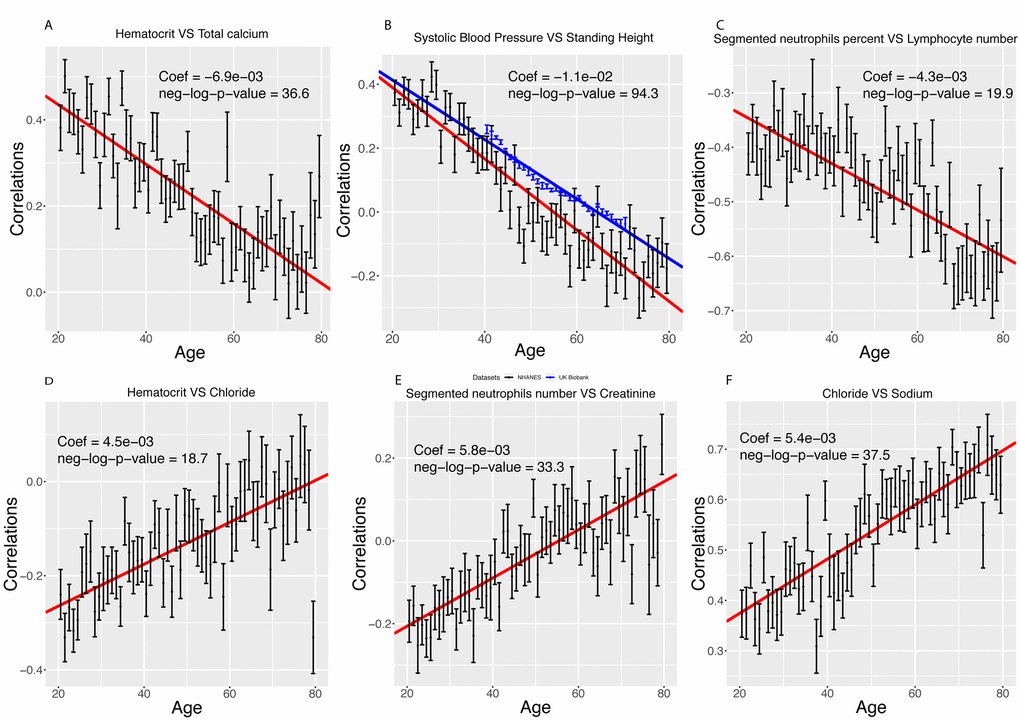
Figure 5.Examples of different trajectories for changes in correlations with age. (A) Hematocrit vs. total calcium. Example of a correlation that decreases with age but remains positive. (B) Standing height vs. systolic blood pressure. Example of a correlation that decreases with age, starts positive and ends negative. In red, we replicated the analysis on the UK Biobank cohort. (C) Percentage of segmented neutrophils vs. number of lymphocytes. Example of a correlation that decreases with age and remains negative. (D) Hematocrit vs. chloride. Example of a correlation that increases with age but remains negative. (E) Percentage of segmented neutrophils vs. creatinine. Example of a correlation that increases with age, starts negative and ends positive. (F) Chloride vs. sodium. Example of a correlation that increases with age and remains positive.