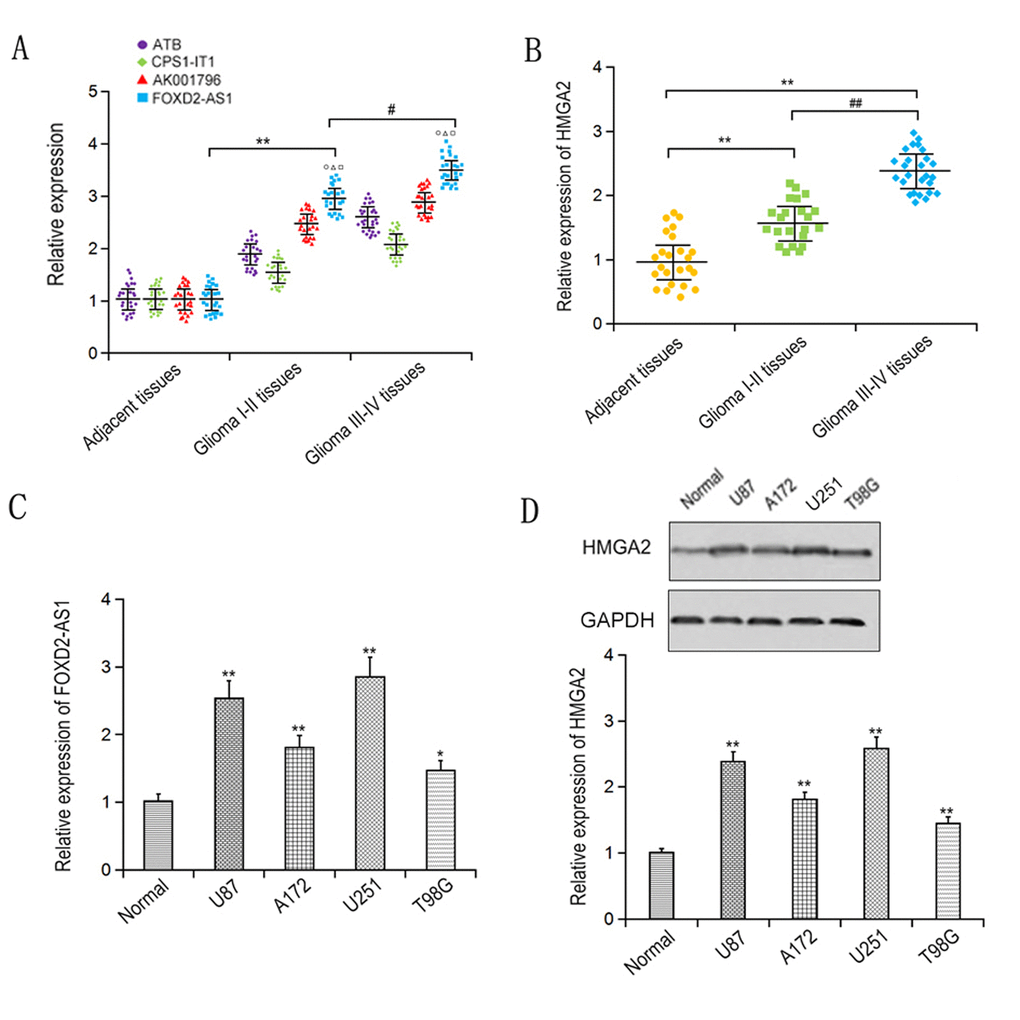
Figure 1.Expression levels of FOXD2-AS1 and HMGA2 were detected in glioma tissues and cells. LncRNA expressions (A) and HMGA2 (B) in glioma tissues were examined by qRT-PCR. The expression of FOXD2-AS1 (C) and HMGA2 (D) in glioma cell lines was examined by qRT-PCR. *p < 0.05, **p < 0.01.