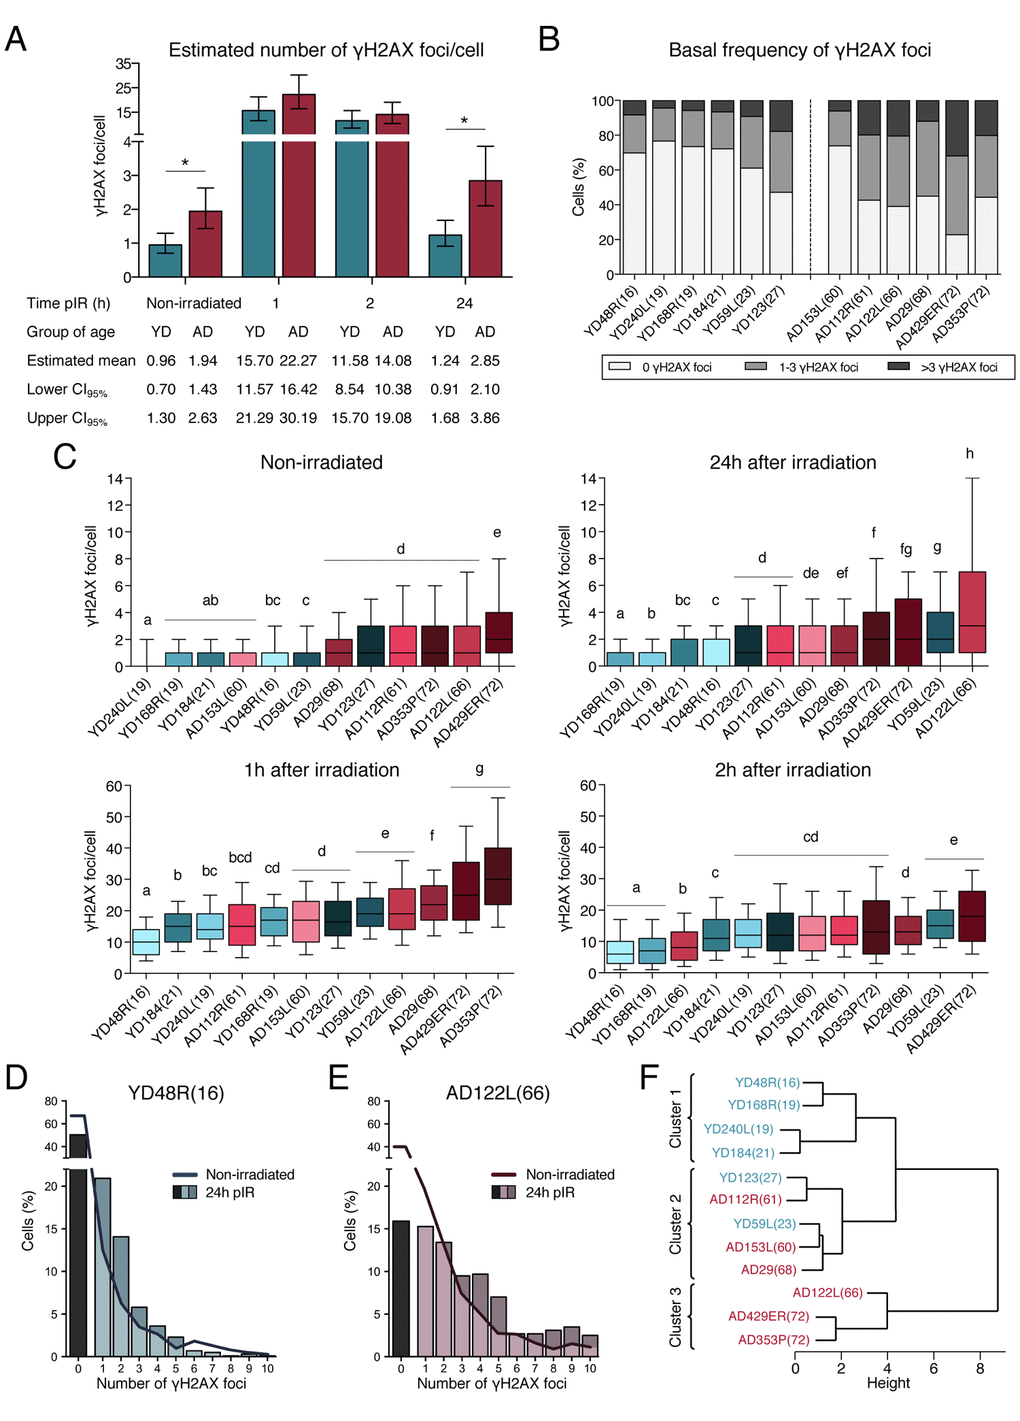
Figure 2.Frequencies of γH2AX foci in HMECs from young and aged donors. (A) Estimated mean number of γH2AX foci/cell and confidence intervals for young and aged donors. Asterisks indicate significant differences between YDs and ADs (generalized linear model, p-value < 0.01). The number of cells analyzed for each donor is stated in Table 1. (B) Frequency of cells with a defined number of γH2AX foci in non-irradiated samples from the 12 donors. The number of cells analyzed for each donor is stated in Table 1. (C) Box plots of the frequency of γH2AX foci in cells from YDs and ADs in non-irradiated samples and at 1h, 2h or 24h after exposure to 1 Gy of γ-rays. Each donor is colored with blue or red depending on the group of age (blue for YDs and red for ADs). In each group, colors become darker with increasing age of the donor. Boxes include data from the upper to the lower quartile. The median is represented with a black line and whiskers compile 10 to 90% of the scored values. The number of cells analyzed for each donor is stated in Table 1. Statistical differences between donors are indicated following a letter code: donors signaled with the same letter do not show statistical differences and therefore different letters indicate statistically significant differences between donors (Kruskal-Wallis test with Dunn’s multiple comparisons correction, p-value < 0.05). (D, E) Distribution of cells according to the number of γH2AX foci/cell individually scored in YD48R(16) (D) and in AD122L(66) (E). Bars indicate the percentage of cells without foci (black bar) or with ≥1 γH2AX foci (colored bars) 24h after irradiation. The continuous line depicts this percentage before irradiation. The number of cells analyzed for each donor is stated in Table 1. (F) Hierarchical clustering of the 12 donors according to the standardized mean number of γH2AX foci scored in non-irradiated samples and at 1, 2 and 24h after IR. The number of cells analyzed for each donor is stated in Table 1.