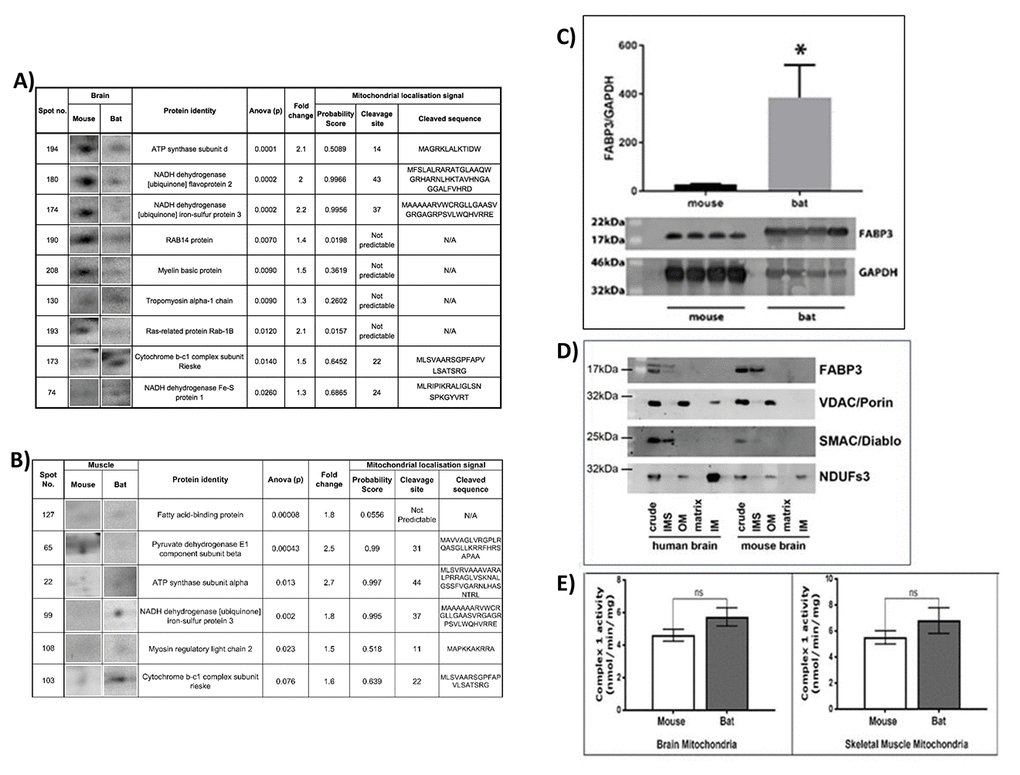
Figure 1.Proteomics analysis of mouse and bat mitochondrial fractions from brain and muscle tissues. Identification of protein changes between the mouse and bat brain mitochondrial proteome. (A) Ten protein spots were selected after (SameSpots) analysis comparing mouse brain mitochondria aged (4-78 weeks (n=8) and bat brain mitochondria (adult, n=4). The table shows the identities of the proteins (MASCOT) and statistical analyses (one-way ANOVA) for each protein spot. The mitochondrial localisation probability, predicted cleavage site and sequence were calculated for each protein using Mitoprot. Identification of protein changes between the mouse and bat skeletal muscle mitochondrial proteome. (B) Six protein spots were selected after (SameSpots) analysis comparing mouse brain mitochondria aged (4-78 weeks (n=6) and bat brain mitochondria (adult, n=6). The table shows the identities of the proteins (MASCOT) and statistical analyses (one-way ANOVA) for each protein spot. The mitochondrial localisation probability, predicted cleavage site and sequence were calculated for each protein using Mitoprot. (C) Fatty Acid Binding Protein 3 (FABP3) levels are significantly higher in the adult bat muscle mitochondria when compared with adult mouse muscle mitochondria. Skeletal muscles were prepared to provide enriched mitochondrial fractions from four adult (>1 year) bats and four adult (12 weeks) mice. Western blotting with an FABP3 antibody confirmed the difference in this protein in mitochondrial samples from the different species. GAPDH antibody was used on the same blot to provide a control for band density normalisation. (D) FABP3 is localised to the mitochondrial inter-membrane space. Antibody to FABP3 was used to detect its presence in sub-mitochondrial preparations from mouse and human brain mitochondria fractions. In both species FABP3 was detected in the inter-membrane space and correlated with the presence of SMAC/Diablo, a specific protein marker for this compartment. (E) Complex 1 activity in the bat and mouse mitochondria. Complex 1 was measured spectrophotometrically in the bat and mouse brain mitochondria. The activity of complex 1 is higher in the bat brain mitochondria however this did not reach significance (p=0.094). Six biological replicates for the mouse brain mitochondria and four biological replicates for the bat brain mitochondria, two measurements were taken per sample. Complex 1 was also measured spectrophotometrically in the bat and mouse skeletal muscle mitochondria. The activity of complex 1 is higher in the bat skeletal muscle mitochondria however this was not significantly different. Eight biological replicates for the mouse brain mitochondria and four biological replicates for the bat brain mitochondria, two measurements were taken per sample. All assays contained 30mg/ml mitochondrial protein. Columns display mean activity ± SEM. A two-tailed t-test with Welch’s correction was performed, ns=no significant difference.