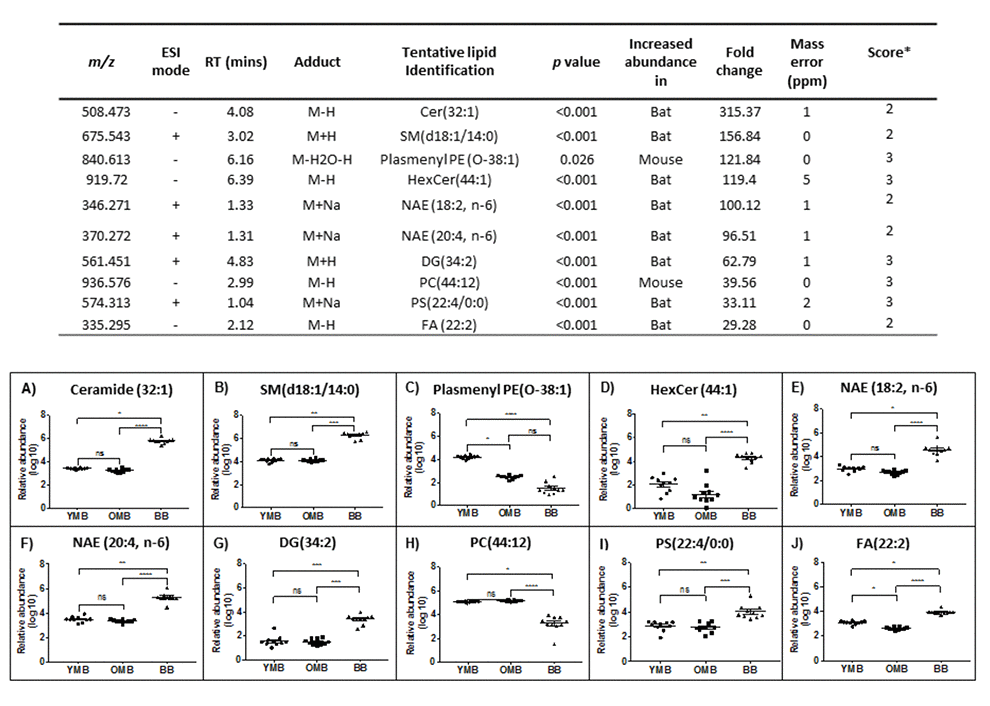
Figure 3.The ten most different lipid abundance scores in our comparison between bat and mouse brain mitochondrial lipidomes. m/z – mass charge ratio, ESI mode – electrospray ionisation mode, RT – run time. Confidence scores calculated as per Sumner et al., 2007 [51]. YMB – Young Mouse Brain, OMB – Old Mouse Brain, BB – Bat Brain. Cer – Ceramide, SM – Sphingomyelin, Plasmenyl PE – Plasmenylphosphatidylethanolamine, HexCer – Hexosylceramide, NAE- n-acylethanolamine, PS- phosphatidylserine, FA- fatty acid, DG - diacylglyceride and PC- phosphatidylcholine. ns p>0.05, * p<0.05, ** p<0.01, *** p<0.001, **** p<0.0001.