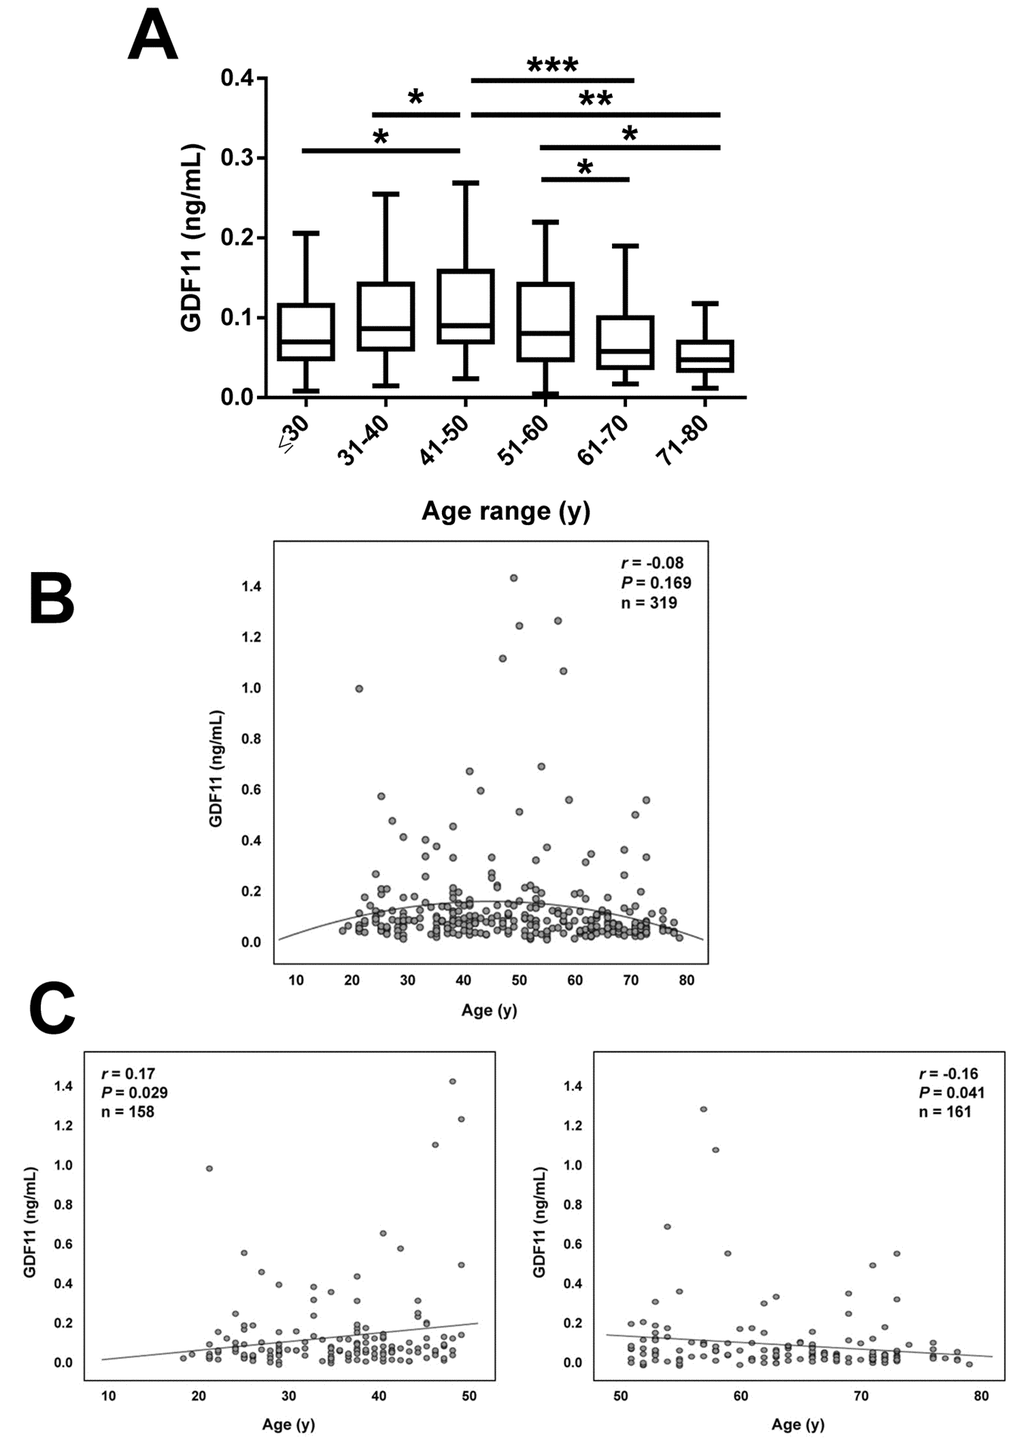
Figure 1.Effect of aging on serum GDF11 concentrations. (A) Comparison of serum GDF11 in the whole sample aged between 18 and 79 y segregated by decades (≤30 y, n=53), (31-40 y, n=54), (41-50 y, n=51), (51-60 y, n=54), (61-70 y, n=59), (71-80 y, n=48). Box represents interquartile range and median inside, with whiskers plotted according to the Tukey method. Statistical differences between groups were analyzed by one-way ANOVA followed by Fisher’s LSD tests. *P<0.05, **P<0.01 and ***P<0.001. (B) Scatter diagram showing the relationship between circulating concentrations of GDF11 and age. Pearson’s correlation coefficient and P value are indicated. The quadratic line of adjustment of data is shown. (C) Scatter diagrams showing the correlation between circulating concentrations of GDF11 and age in the subjects segregated by being below (left) or over (right) 50 years of age. Pearson’s correlation coefficients and P values are indicated.