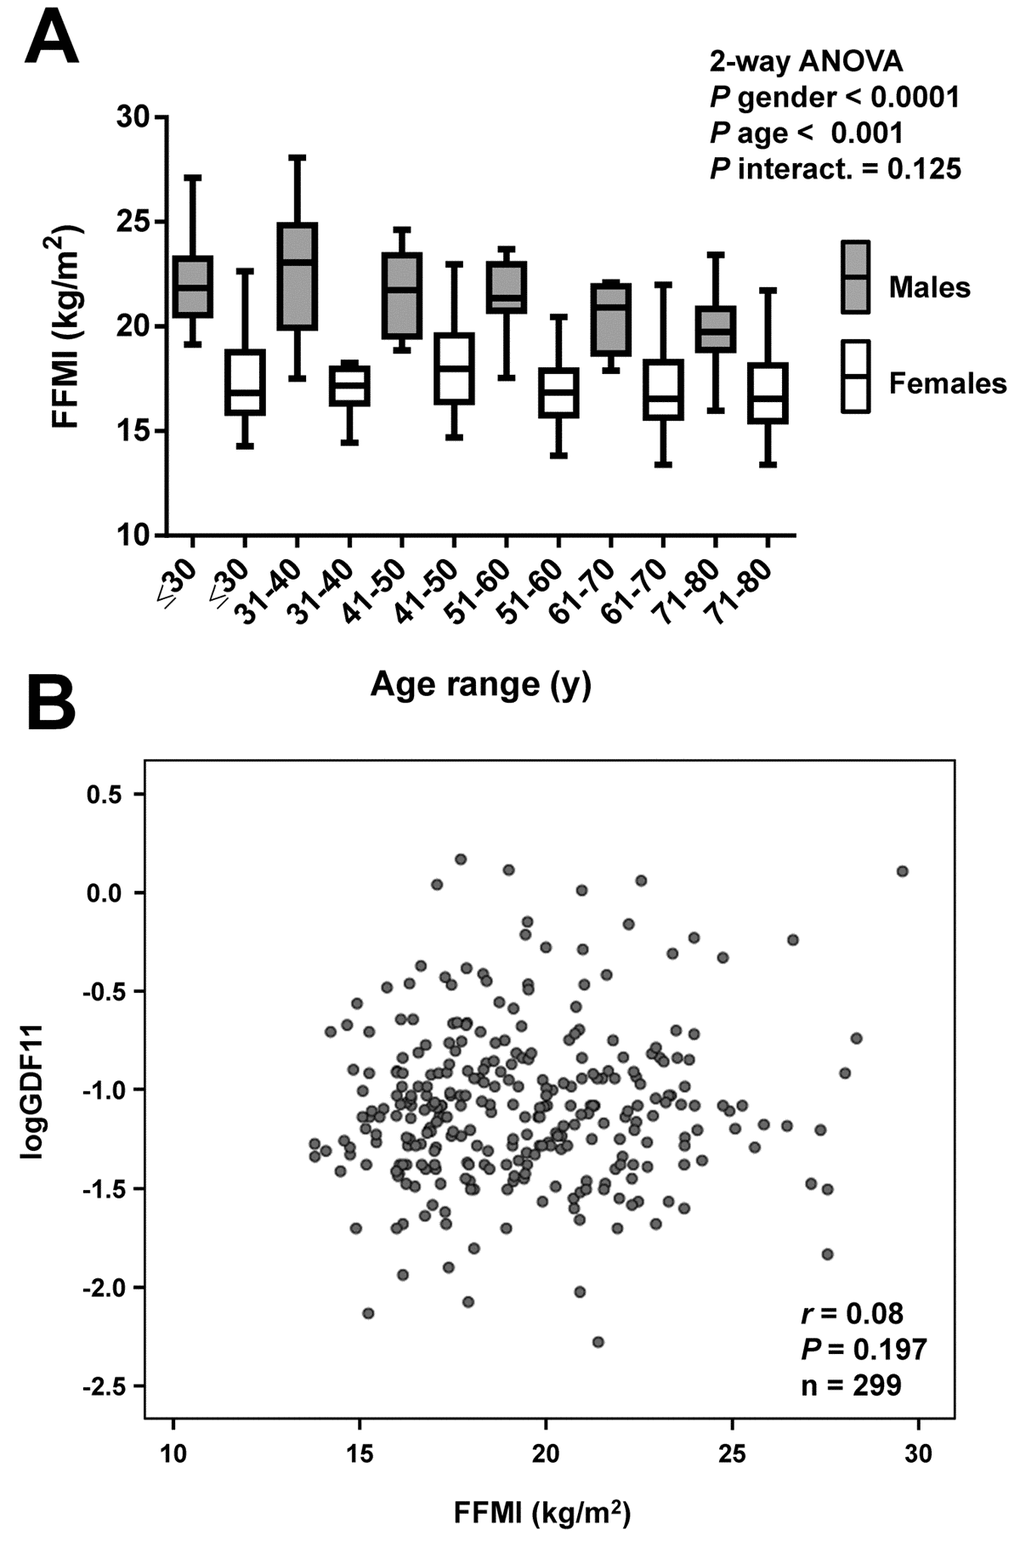
Figure 2.Correlation of GDF11 levels with FFMI. (A) Comparison of fat-free mass index (FFMI) in the whole sample aged between 18 and 79 y segregated by gender (males in grey and females in white) and decades (≤30 y, males n=18, females n=31), (31-40 y, males n=20, females n=34), (41-50 y, males n=24, females n=27), (51-60 y, males n=21, females n=33), (61-70 y, males n=14, females n=35), (71-80 y, males n=20, females n=22). Box represents interquartile range and median inside, with whiskers plotted according to the Tukey method. Statistical differences between groups were analyzed by two-way ANOVA. (B) Scatter diagram showing the relationship between circulating concentrations of GDF11 and FFMI. Pearson’s correlation coefficient and P value are indicated.