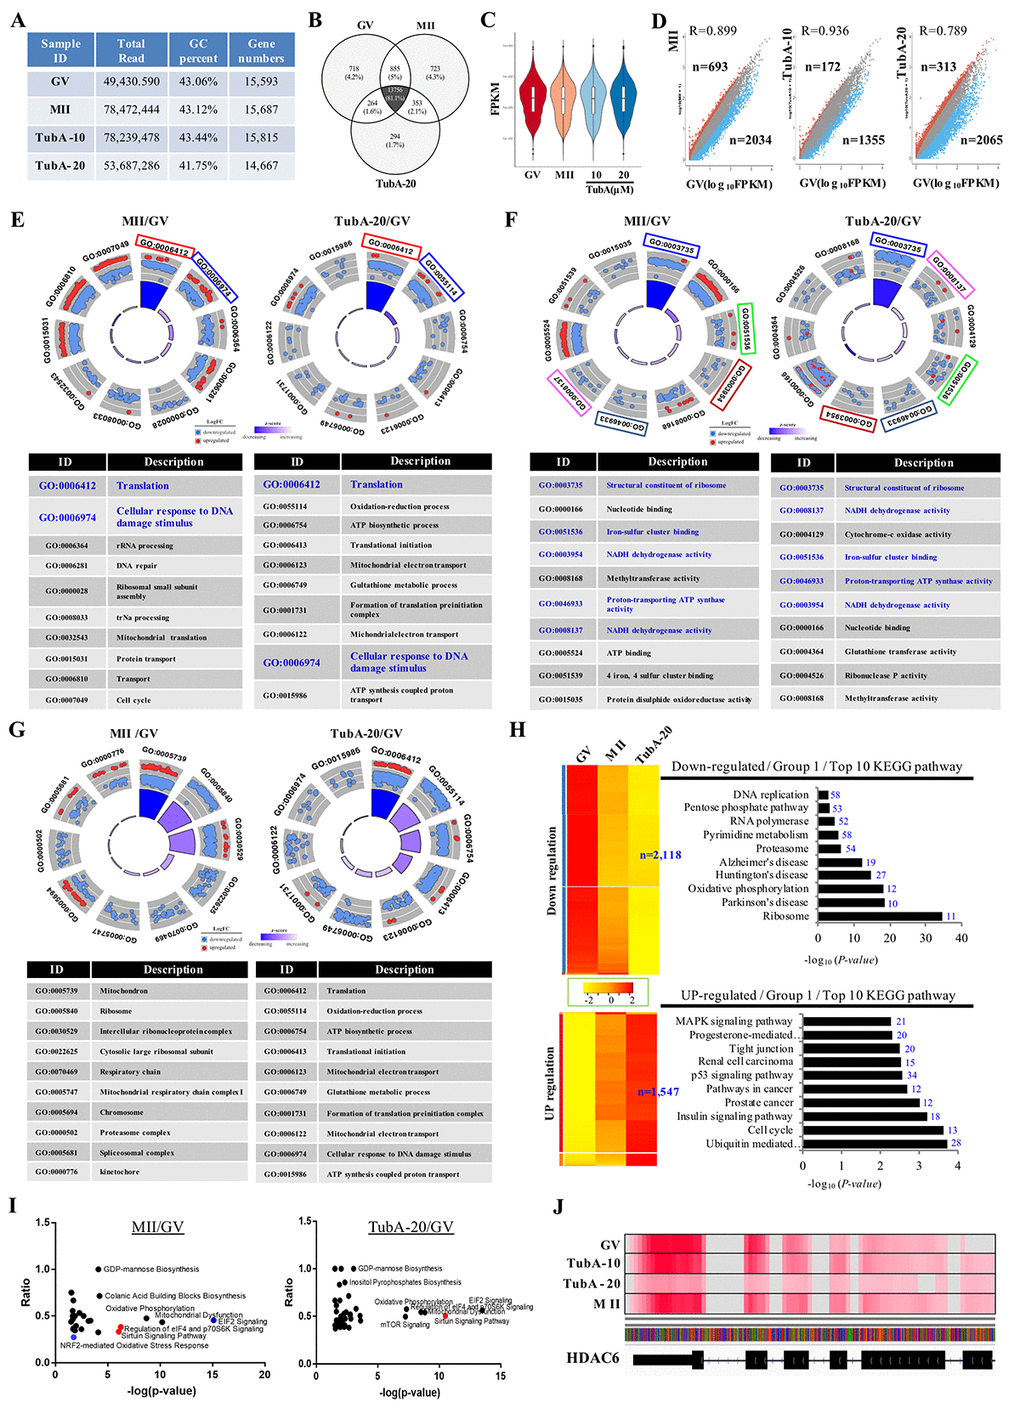
Figure 1.Gene expression is altered in TubA treated oocytes. (A) Sequence reads and number of unique genes in GV, MII, and the TubA (10 and 20 μM)-treated group. (B) Venn diagram showing the overlap between DEGs in GV, MII, TubA-10-, and TubA-20-treated oocytes. (C) Violin plots of differential gene expression profiles identified by SCPattern analysis. The y-axis indicates normalized expression values, FPKM. The x-axis indicates oocyte stage or TubA dosage of each sample. (D). Scatterplot comparing the transcriptomes of GV, MII, with or without TubA-10 and/or TubA-20. Blue dots indicate significantly decreased genes, while red dots indicate more highly expressed genes. (E-G). GO circle plot analysis of RNA-seq in MII/GV and TubA20/GV pairs. The outer circle shows a scatter plot for each term of the log10FC of the assigned genes in each enriched gene ontology (GO) term: biological process (E), molecular function (F), cellular component (G). Red circles display upregulation and blue circles display downregulation by default. The inner ring is a bar plot where the height of the bar indicates the significance of the GO terms (log10-adjusted p value), and color corresponds to the z-score: green, decreased; red, increased; and white, unchanged. (H, I) Canonical signaling pathways enriched in MT/GV and TubA-20/GV differentially expressed genes (ingenuity pathway analysis [IPA]). The ratio of differentially expressed genes in the pathways is shown for pathways with Benjamini-Hochberg-corrected p values <0.01. Activated or repressed pathways in (I) are shown as red and blue dots, respectively. Specific enriched pathways are highlighted. (J) Genome browser view depicting differential expression in fragment count for the Hdac6 gene. At the gene level, overall, there is a large difference between control-GV (or –MII) and TubA-20, as shown in read coverage profiles. Red color indicates abundant transcripts of Hdac6 mRNA.