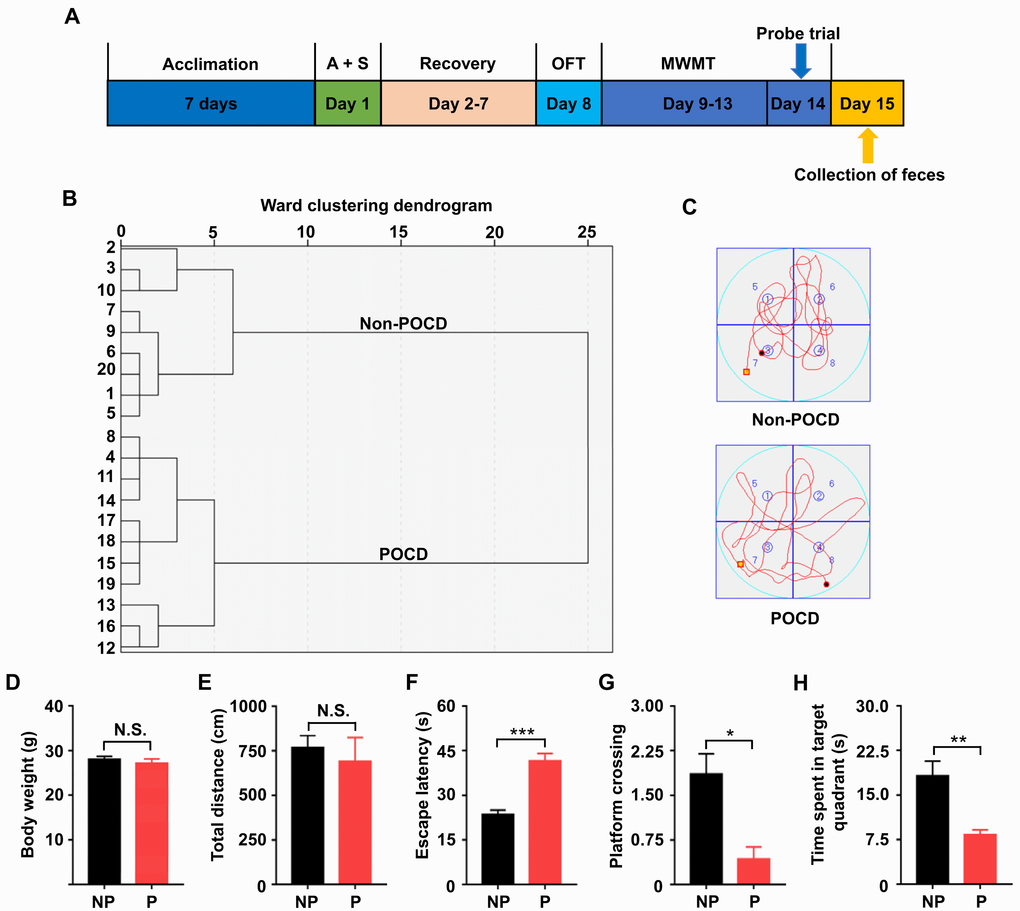
Figure 1.Comparisons of OFT and MWMT between the non-POCD and POCD groups. (A) The schedule of the present study. Seven days after acclimation, A + S was performed. OFT was performed on day 8 after 6 days of recovery. On days 9–14, mice were scheduled for the MWMT, and the probe trial was performed on day 14. On day 15, fecal samples were collected for 16S rRNA gene sequencing. (B) Dendrogram of hierarchical clustering analysis. A total of 20 mice were categorized into non-POCD and POCD groups based on MWMT results of the hierarchical clustering analysis. (C) Representative trace graphs of non-POCD and POCD mice in the MWMT. (D) Body weight (t = 0.7618, P >.05). (E) Total distance in OFT (t = 0.5285, P >.05). (F) Escape latency (t = 6.227, P <.001). (G) Platform crossing (t = 3.612, P <.05). (H) Time spent in target quadrant (t = 3.897, P <.01). A + S: anesthesia and surgery; MWMT: Morris water maze test; NP: non-POCD; N.S.: not significant; OFT: open field test; P: POCD. Data are shown as mean ± S.E.M. (n = 7). *P <.05, **P <.01 or ***P <.001.