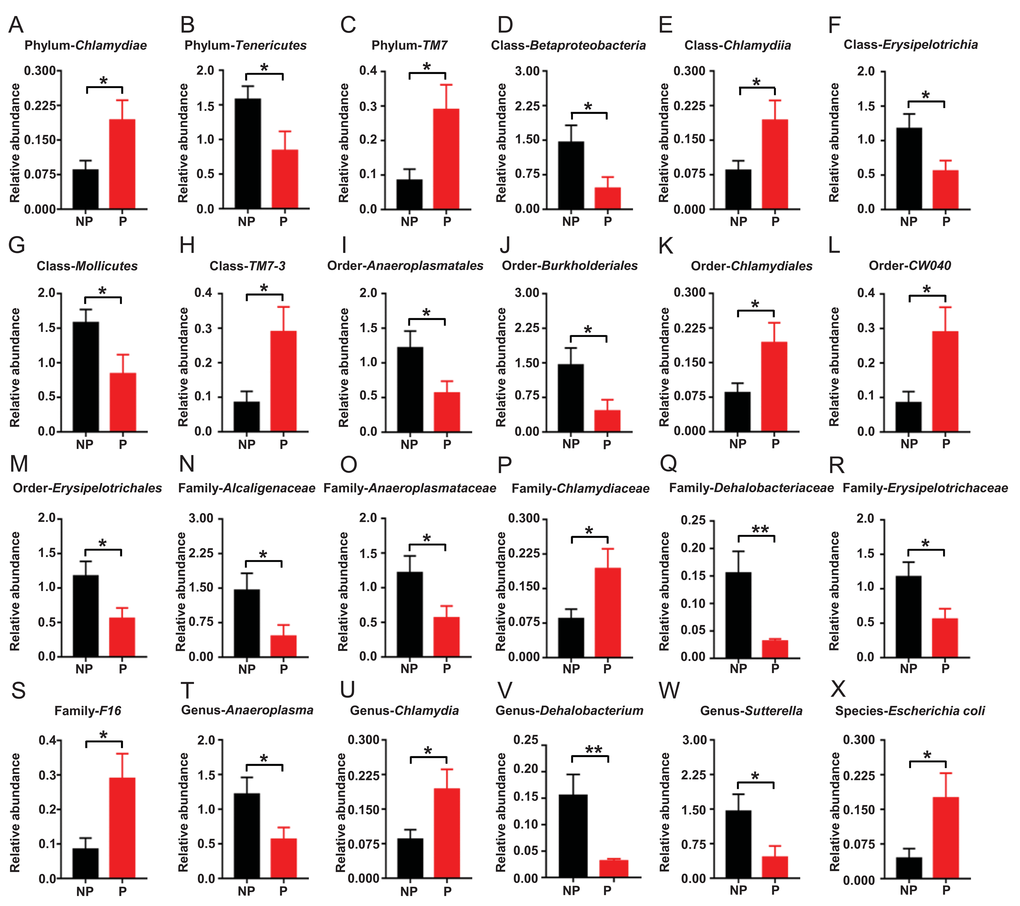
Figure 4.Differential levels of the gut bacterium between the non-POCD and POCD groups. (A) Relative abundance of Phylum Chlamydiae (t = 2.258, P <.05). (B) Relative abundance of Phylum Tenericutes (t = 2.186, P <.05). (C) Relative abundance of Phylum TM7 (t = 2.591, P <.05). (D) Relative abundance of Class Betaproteobacteria (t = 2.255, P < 0.05). (E) Relative abundance of Class Chlamydiae (t = 2.258, P <.05). (F) Relative abundance of Class Erysipelotrichia (t = 2.359, P <.05). (G) Relative abundance of Class Mollicutes (t = 2.186, P <.05). (H) Relative abundance of Class TM7-3 (t = 2.591, P <.05). (I) Relative abundance of Order Anaeroplasmatales (t = 2.208, P <.05). (J) Relative abundance of Order Burkholderiales (t = 2.255, P <.05). (K) Relative abundance of Order Chlamydiales (t = 2.258, P <.05). (L) Relative abundance of Order CW040 (t = 2.591, P <.05). (M) Relative abundance of Order Erysipelotrichales (t = 2.359, P <.05). (N) Family Alcaligenaceae (t = 2.255, P <.05). (O) Relative abundance of Family Anaeroplasmataceae (t = 2.208, P <.05). (P) Relative abundance of Family Chlamydiaceae (t = 2.258, P <.05). (Q) Relative abundance of Family Dehalobacteriaceae (t = 3.118, P <.01). (R) Relative abundance of Family Erysipelotrichaceae (t = 2.359, P <.05). (S) Relative abundance of Family F16 (t = 2.591, P <.05). (T) Relative abundance of Genus Anaeroplasma (t = 2.208, P <.05). (U) Relative abundance of Genus Chlamydia (t = 2.258, P <.05). (V) Relative abundance of Genus Dehalobacterium (t = 3.118, P <.01). (W) Relative abundance of Genus Sutterella (t = 2.255, P <.05). (X) Relative abundance of Species Escherichia coli (t = 2.263, P <.05).