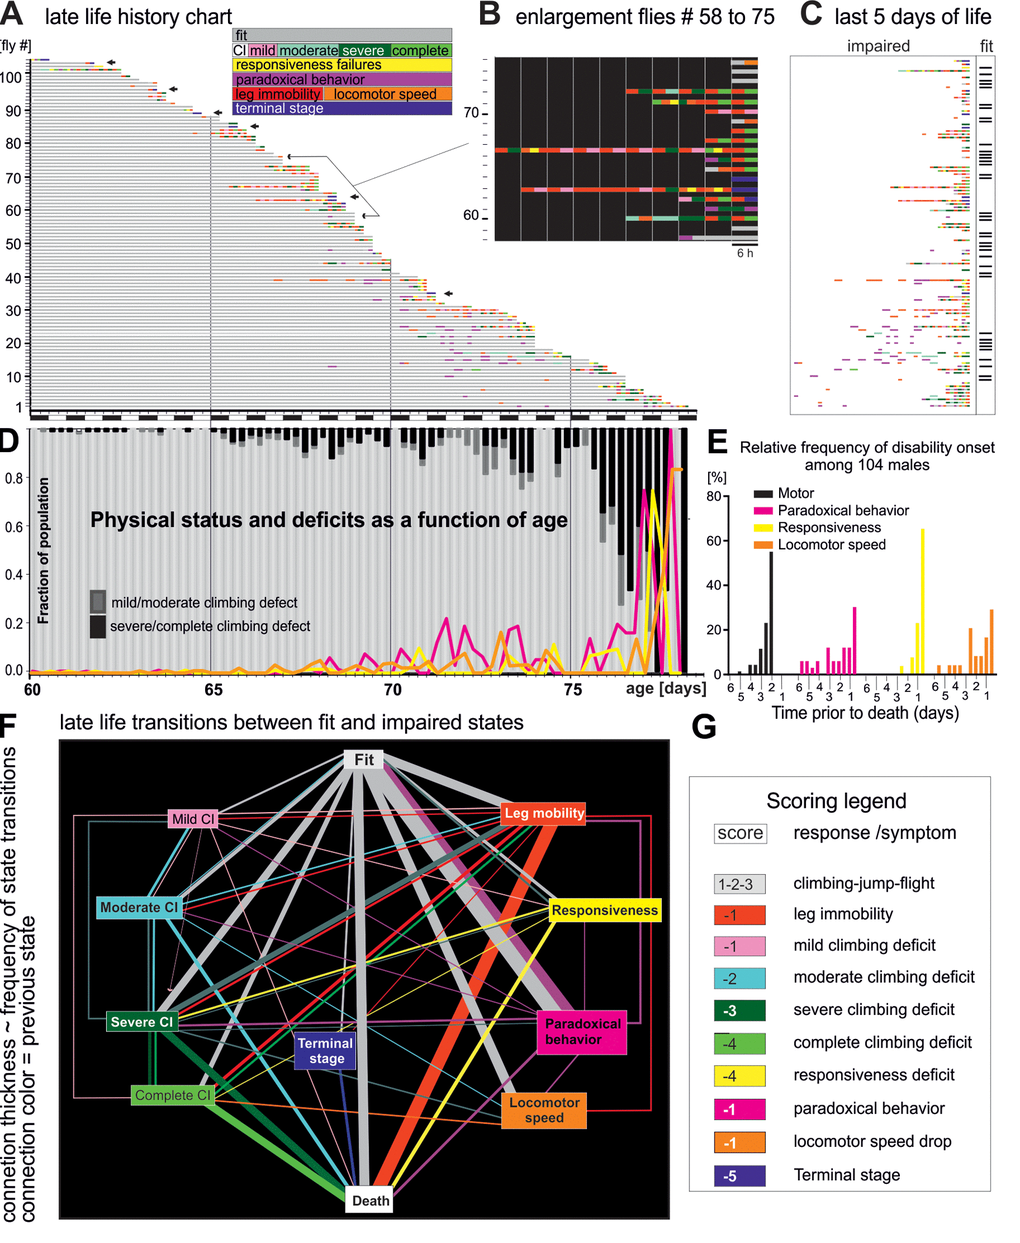
Figure 1.Late-life pathophysiology of locomotor behavior. (A) Life history chart for 104 flies individually tested in the startle assay every 6 hours from the age of 60 days until death. Gray bars indicate health-span and colored bars disabilities of different categories (see colored inset, note that flies can also receive multiple scores at one testing time, e.g. leg immobility and climbing deficit). Arrows mark individuals that exhibited hyperactivity prior to death (see also Figure 3). Black and white bars on x-axis indicate day-night cycle. (B) Selective enlargement of the last 60 hours of life of flies 58 to 75. (C) Time enlargement of the last 5 days for all flies. (D) The fraction of the cohort being either fit (light gray bars) or showing climbing impairments (mild/moderate dark gray bars; severe/complete, black bars) plotted over time. The percentages of animals with impaired responsiveness (yellow), reduced moving speed (orange), and paradoxical behavior (purple) are depicted by colored lines. (E) Frequency distribution of the onset of four disability categories for all 104 flies. (F) Ethogram depicts the relative frequencies of transitions (line thicknesses) between fit (grey box), various pre-death impairments (colored boxes), and death (white box). The thickness of the connecting lines depicts the relative frequency of the occurrence of the respective state transition, and the color indicates the previous state. (G) Scores used for quantification of the degree of fitness.