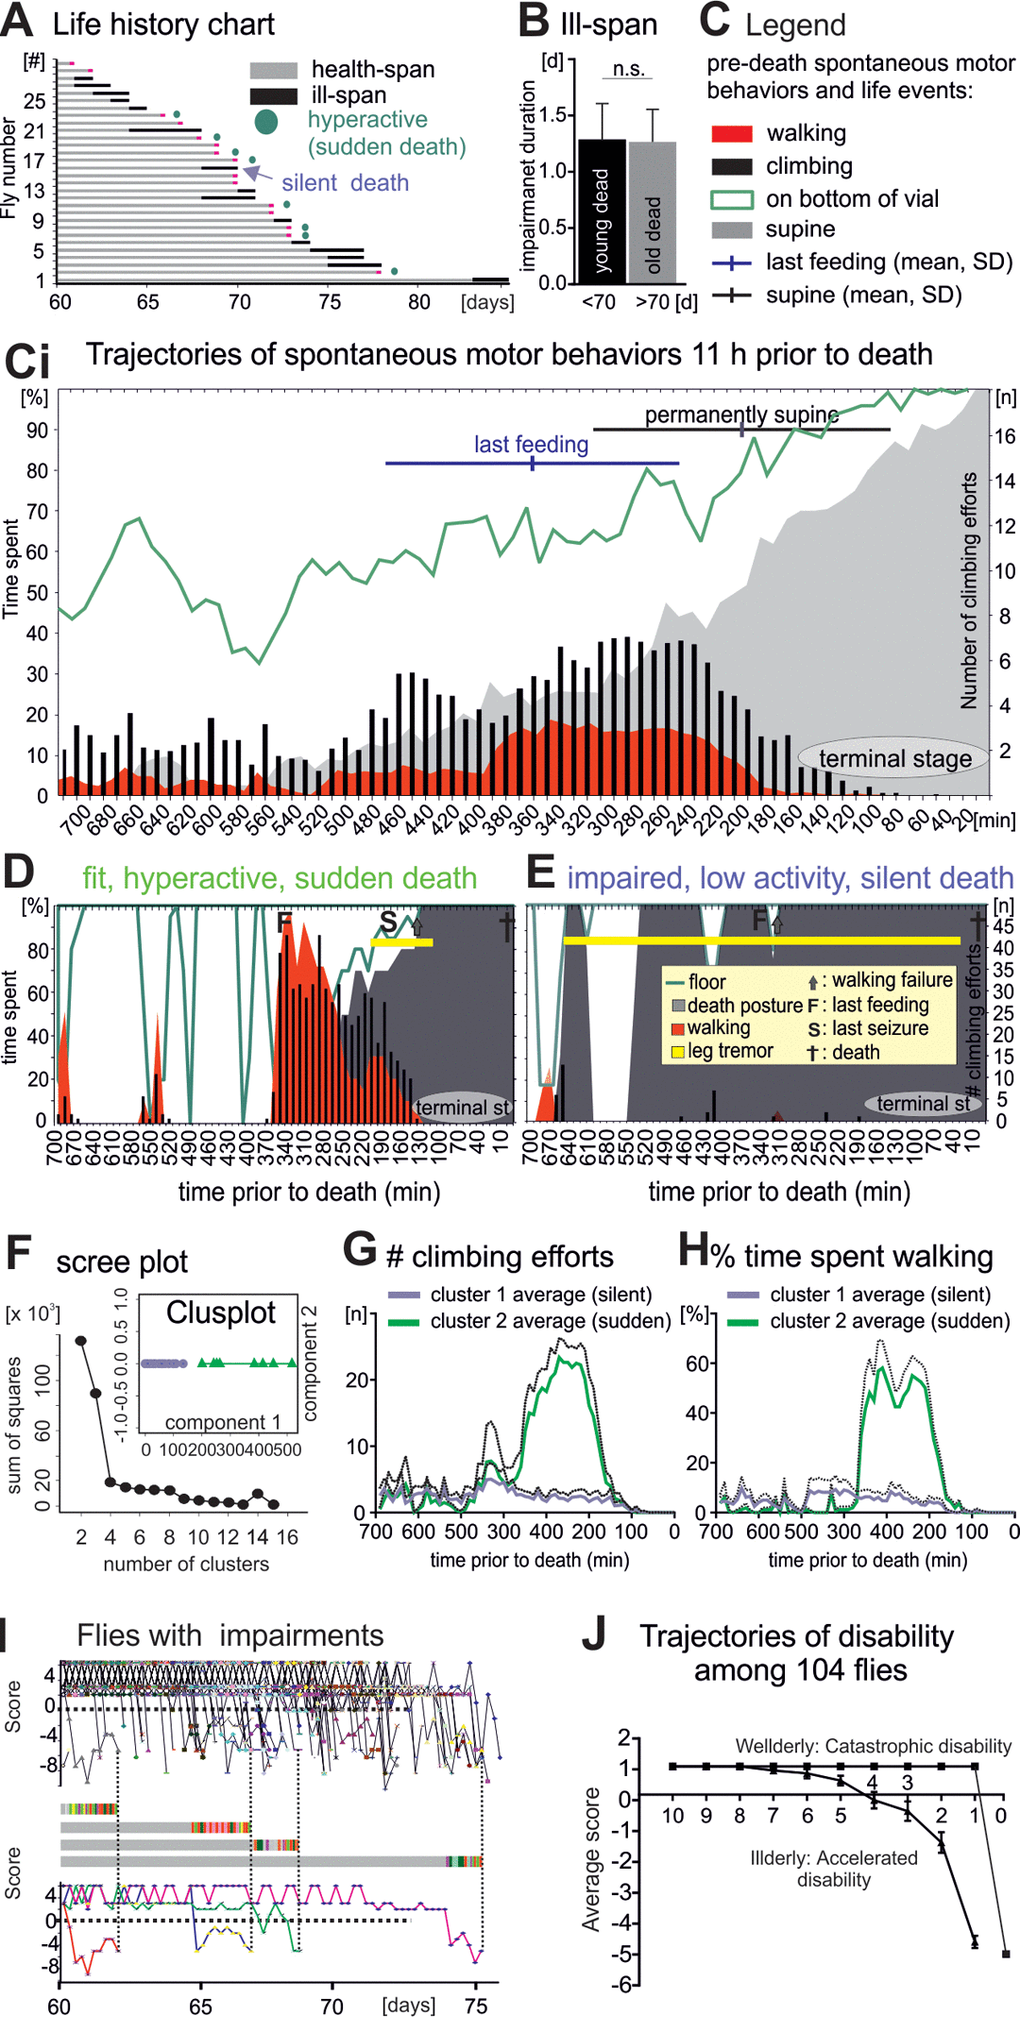
Figure 4.Flies die in two different modes: Sudden versus silent death. (A) Life history chart for 30 flies filmed continuously from age 60 days until death. Health-span is indicated by horizontal gray bars and ill-span by black bars. Circles mark animals without impairments but with a short period of hyperactivity during late-life (see below). Black arrows demarks an example animal with multiple days of ill-span. (B) Impairment duration was statistically similar in flies dying younger (black bar) versus older than 70 days (grey bar, students T-test, p > 0.9). (C) Legend for (Ci), which shows the occurrence of different spontaneous behaviors during the last 11 hours of life plotted as cohort averages in time bins of 10 minutes (x- axis). Percent time spent (left y-axis) walking (red), standing on the wall or the bottom of the vial (green line), being immobile or in a supine position (gray). Black bars depict the number of climbing efforts (right y-axis). Horizontal bars depict cohort averages and SEMs for the time of the last feeding (blue) and for entering a permanent supine position (black). (D-E) Same data presentation as in C but for a representative animal with high locomotor activity and no impairments until the last day (D, sudden death) as compared to a representative animal with impairments and low locomotor activity (E, silent death). (F) Principle component analysis revealed two distinct clusters of animals. (G, H) Number of climbing efforts (G) and time spent walking (H) (averages, solid lines; SD, dotted lines) in bins of 10 minutes during the last 11 hours of live for all cluster 1 animals (blue) versus all cluster 2 animals (green). (I) Fitness scores of every illderly fly from the startle assay cohort of 104 flies (see also Figure 1) plotted over age (upper panel). Fitness to impairment state transition can be sudden or gradual as exemplified by the score changes of four individuals (middle and lower panels). (H) The average score of all wellderly versus all illderly flies from the startle assay (see figure 1) plotted over the last 10 days of life follows different trajectories.
Figure 4 — Longitudinal assessment of health-span and pre-death morbidity in wild type Drosophila | Aging