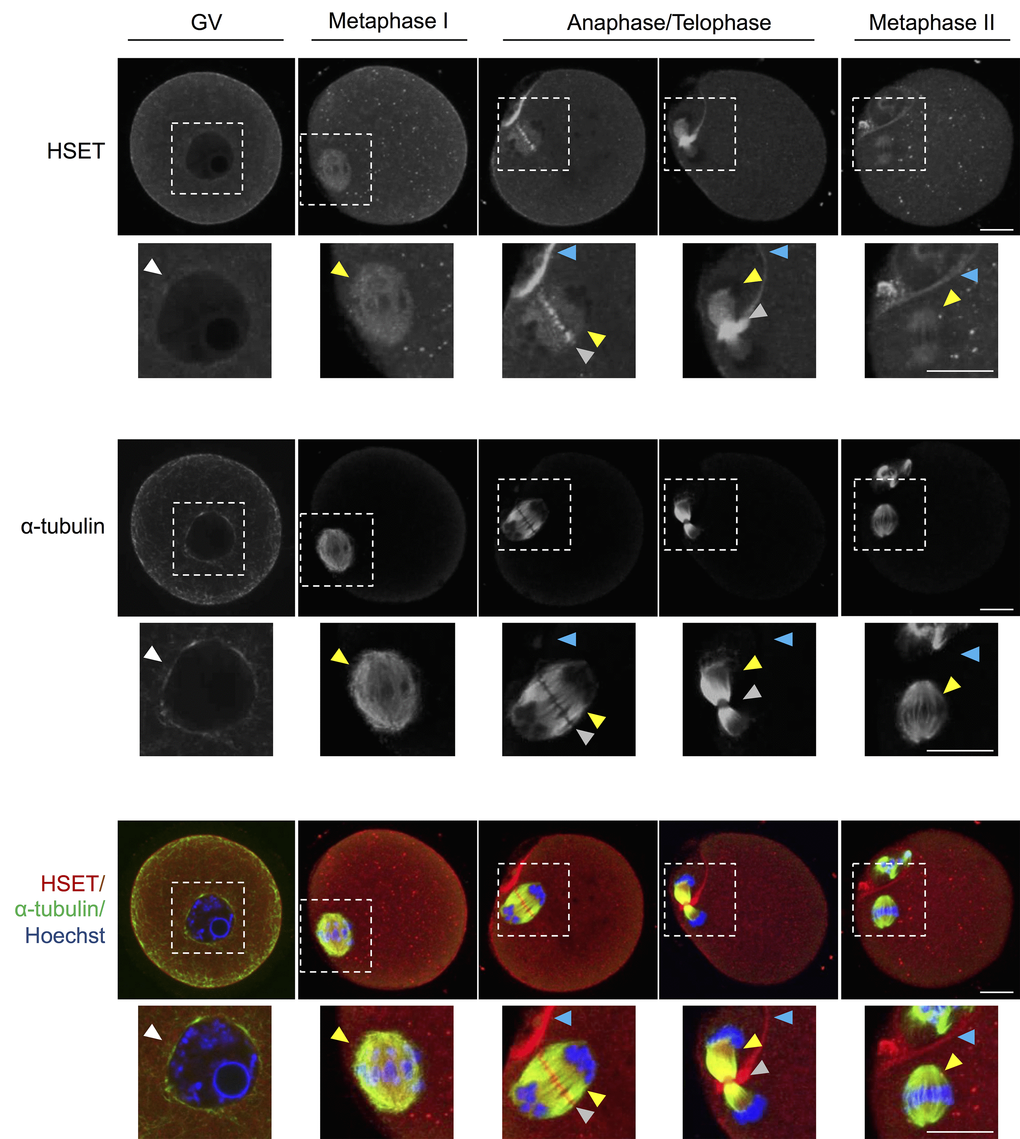
Figure 6.HSET expression throughout oocyte meiosis. Immunofluorescence analysis was utilized to track the spatial profile of HSET distribution in GV, MI, anaphase I/telophase I, and MII stage oocytes. Inserts highlight the localization of HSET to the nuclear envelope (white arrowheads), microtubules (yellow arrowheads), between the chromosomes (grey arrowheads), and at the partitioning of the polar body (blue arrowheads). Oocytes were dual labelled with anti-HSET and anti-α-tubulin antibodies followed by either appropriate goat anti-rabbit 633 Alexa Fluor (red) or goat anti-mouse 488 Alexa Fluor-conjugated (green) secondary antibodies, respectively. Oocytes were then counterstained with the nuclear stain Hoechst 33342 (blue) and viewed using confocal microscopy. Scale bar = 20 μm. These experiments were repeated using three independent biological replicates, with each comprising a minimum of 10 oocytes, and representative images are shown.