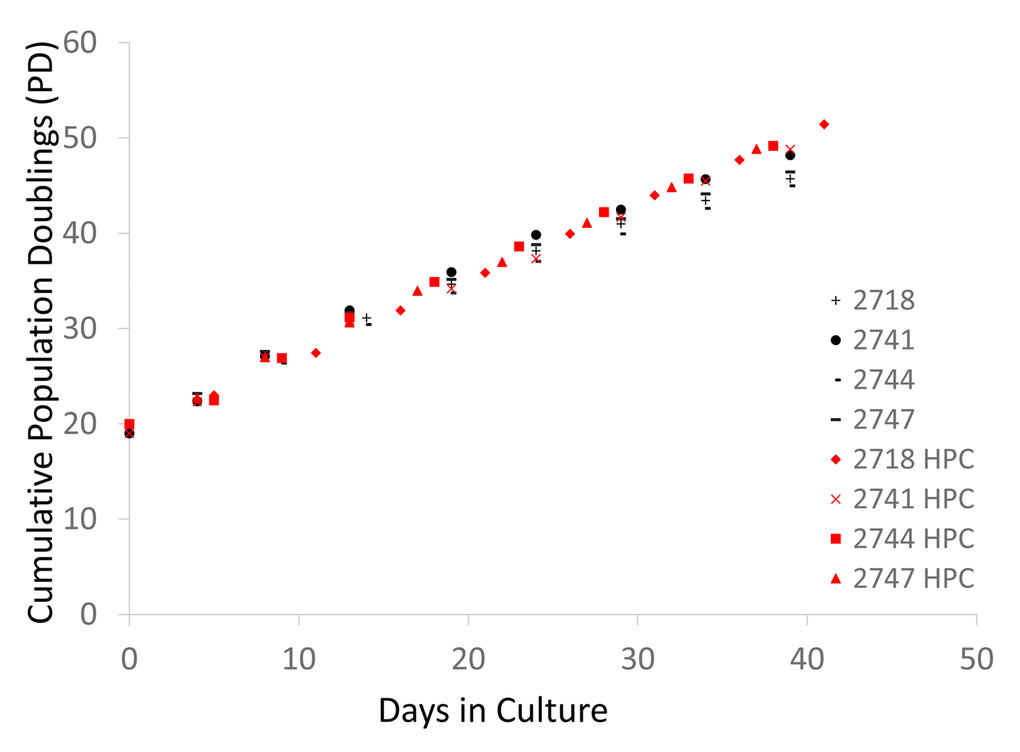
Figure 1.Cell division records of neonate fibroblast cell lines cultured in normoxia and hypoxia. Each 4-digit number in the graph (#2718, #2741, #2744, and # 2747) indicates the batch of the cell line from the vendor (Cell Applications, San Diego, CA). The graph shows the cumulative population doublings (PD) of each cell line in normoxia and hypoxia. Black and red symbols indicate the data from normoxia and hypoxia, respectively.