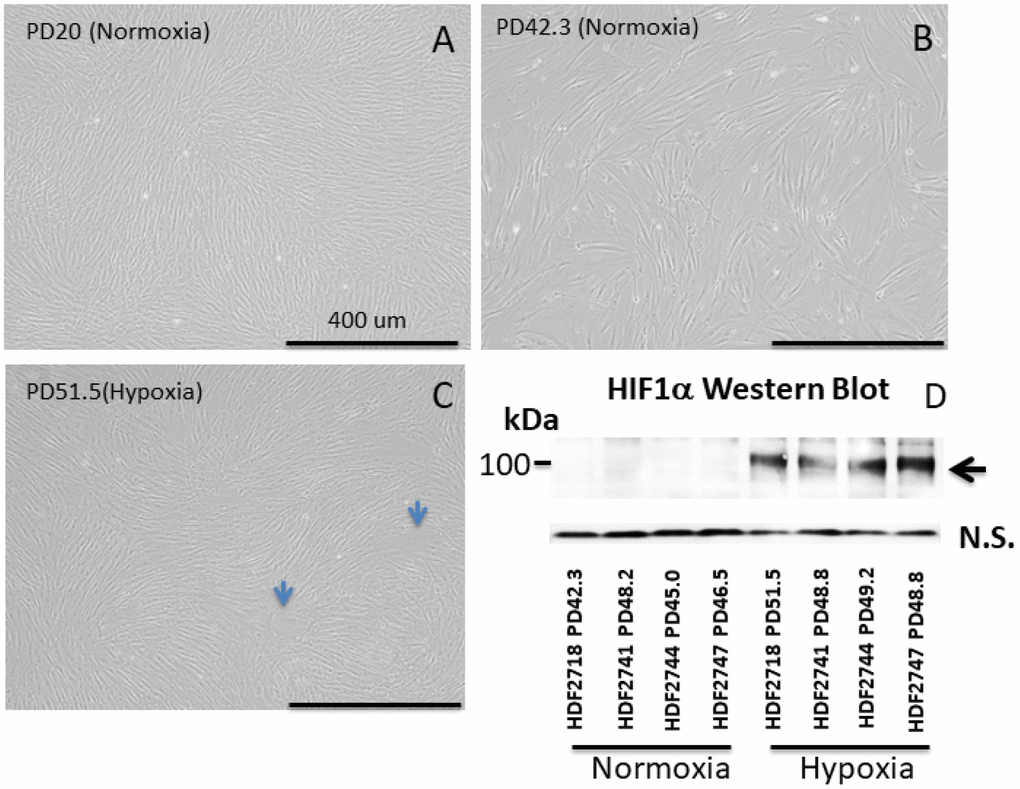
Figure 2.Images of neonate human dermal fibroblasts (HDFs) (A–C) and Western blot of HIF1α (D). (A–C) HDFs cultured in normoxia and hypoxia. All images were taken at the same magnification. Each 4-digit number in the graph (#2718, #2741, #2744, and # 2747) indicates the batch of the cell line from the vendor (Cell Applications, San Diego, CA). Bar: 400 μm. (A) HDFs at population doubling (PD) number 20 in normoxia, (B) HDFs at PD 42.3 in normoxia, (C) HDFs at PD 51.5 in hypoxia. Cells cultured in hypoxia maintained a small cell size in comparison with cells in normoxia. (D) Western blot of HIF1α. HIF1α was stabilized in all 4 cell lines cultured under hypoxia.