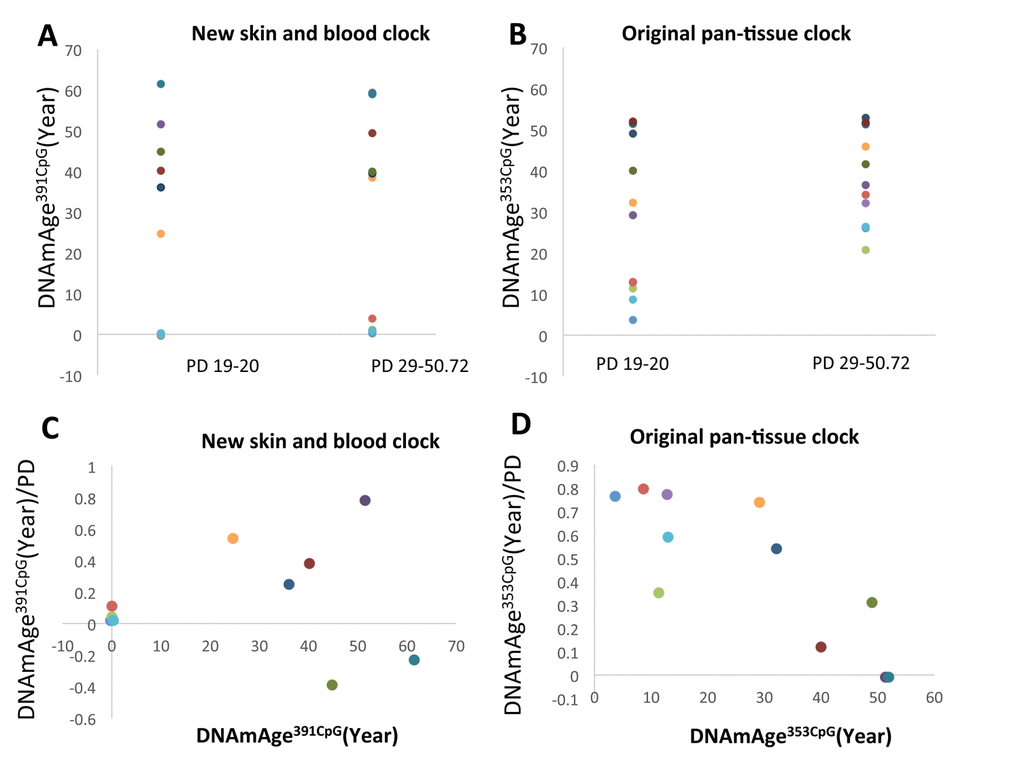
Figure 5.The progression of DNAm age after more than 10 PD of fibroblasts from donors of different ages from. (A and B) The progression of DNAmAge391CpG (A) and DNAmAge353CpG (B) after more than 10 PD of cell culture is shown. Each panel shows the following information: (A and B) Changes of DNAm age after more than 10 PD. (C and D) The Y axis indicates the values of DNAmAge391CpG/PD (C) and DNAmAge353CpG/PD (D). The X-axis indicates the DNAm age at the beginning of this experiment. The impact of PD on the speed of DNAm age progression becomes greater when the starting DNAmAge391CpG is older, but becomes lesser when the starting DNAmAge353CpG is older. The dots with the same color are the results from the same cell line.