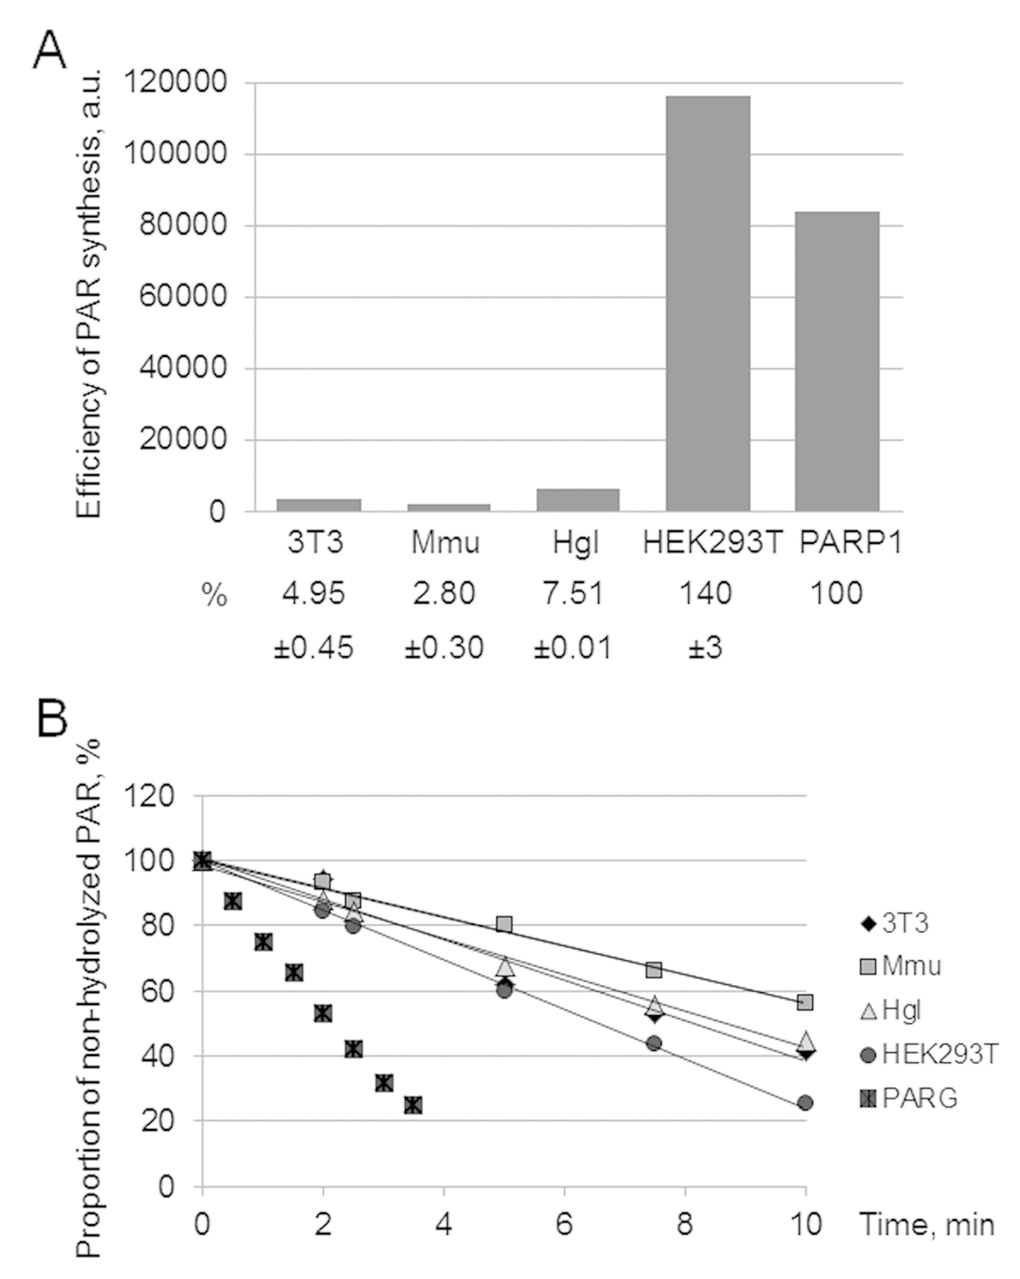
Figure 1.Efficiency of PAR synthesis (A) and degradation (B) in WCEs. (A) PAR synthesis was performed for 1 min at 37 °C in the reaction mixture containing standard buffer components and 0.6 A260/mL activated DNA, 0.5 mg/mL cell extract proteins (or 10 nM recombinant human PARP1), and 20 μM [32P]NAD+. The reaction mixtures were treated and analyzed as described in the section ‘Synthesis and degradation of PAR in the extracts. PARP activity assay’. The yield of PAR analyzed by SDS-PAGE (the gel is shown in Fig. S1) is represented as a bar chart in arbitrary phosphorimager units. The analysis of PAR synthesis for three independent experiments is shown in numerical form under the bar chart. The data are the mean ± SD. In each experiment, the amount of PAR synthesized in the extract was normalized to that synthesized by 10 nM recombinant PARP1. (B) The reaction mixtures containing standard components, [32P]PAR synthesized as described in the section ‘Synthesis and degradation of PAR in the extracts. PARP activity assay’, and 0.5 mg/mL cell extract proteins or 10 nM recombinant PARG were incubated at 37 °C for different time intervals. Aliquots were further processed and analyzed as described in the section ‘Synthesis and degradation of PAR in the extracts. PAR degradation assay’. The amount of [32P]PAR in an equal aliquot of the control mixture (no proteins added) before incubation was taken as 100%. The points on the experimental curves represent the average of three independent experiments. Standard deviation did not exceed 10%.