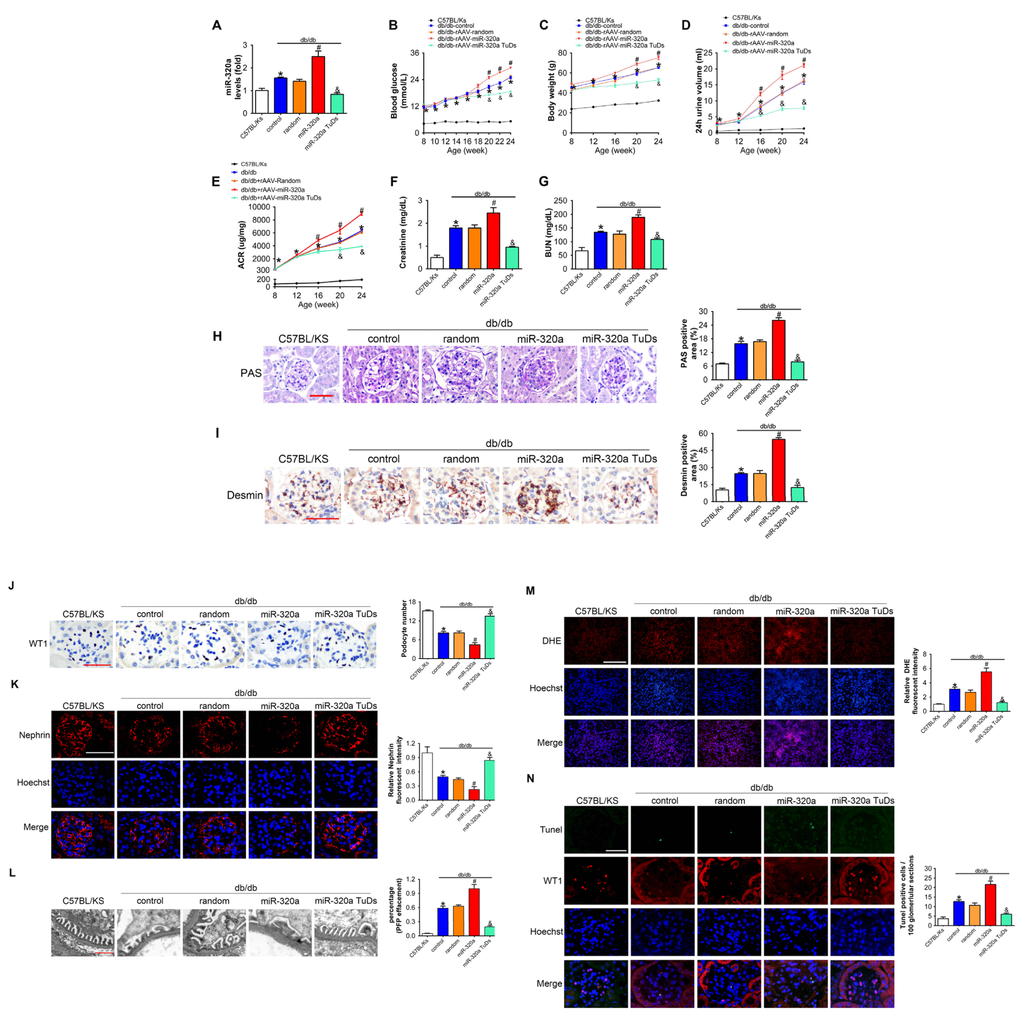
Figure 2.Overexpression of miR-320a aggravated renal dysfunction in db/db mice. (A) Relative miR-320a expression in renal cortex measured by real-time PCR. (B) Blood glucose was detected every 2 weeks. (C) Body weight, (D) 24h urine volume and (E) urinary ACR was determined every four weeks since the age of 8 weeks. (F) Serum creatinine and (G) BUN were detected at the age of 24 weeks. (H) Representative images of PAS staining of kidneys from C57BL/Ks and differently treated db/db mice. Scale bar, 50 μm. (I) Representative images of immunohistochemical staining of Desmin. Scale bar, 50 μm. (J) Typical images of WT1-stained glomeruli and average number of WT1-stained nuclei calculated per glomerular sections. Scale bar, 50 μm. (K) Representative images of immunofluorescence staining for Nephrin. Scale bar, 50 μm. (L) Representative electron microscopic image of the glomeruli staining from kidney sections. Scale bar, 1 μm. (M) Representative images of ROS detected by DHE probe in frozen kidney sections. Scale bar, 200 μm. (N) Typical images of apoptotic glomerular cells in diabetic glomeruli. Green, TUNEL; Red, WT1; Blue, Hoechst. Scale bar, 50 μm. Data are expressed as mean ± SEM, n=8, *P<0.05 versus C57BL/Ks, #P<0.05 versus db/db control, &P<0.05 versus db/db control.