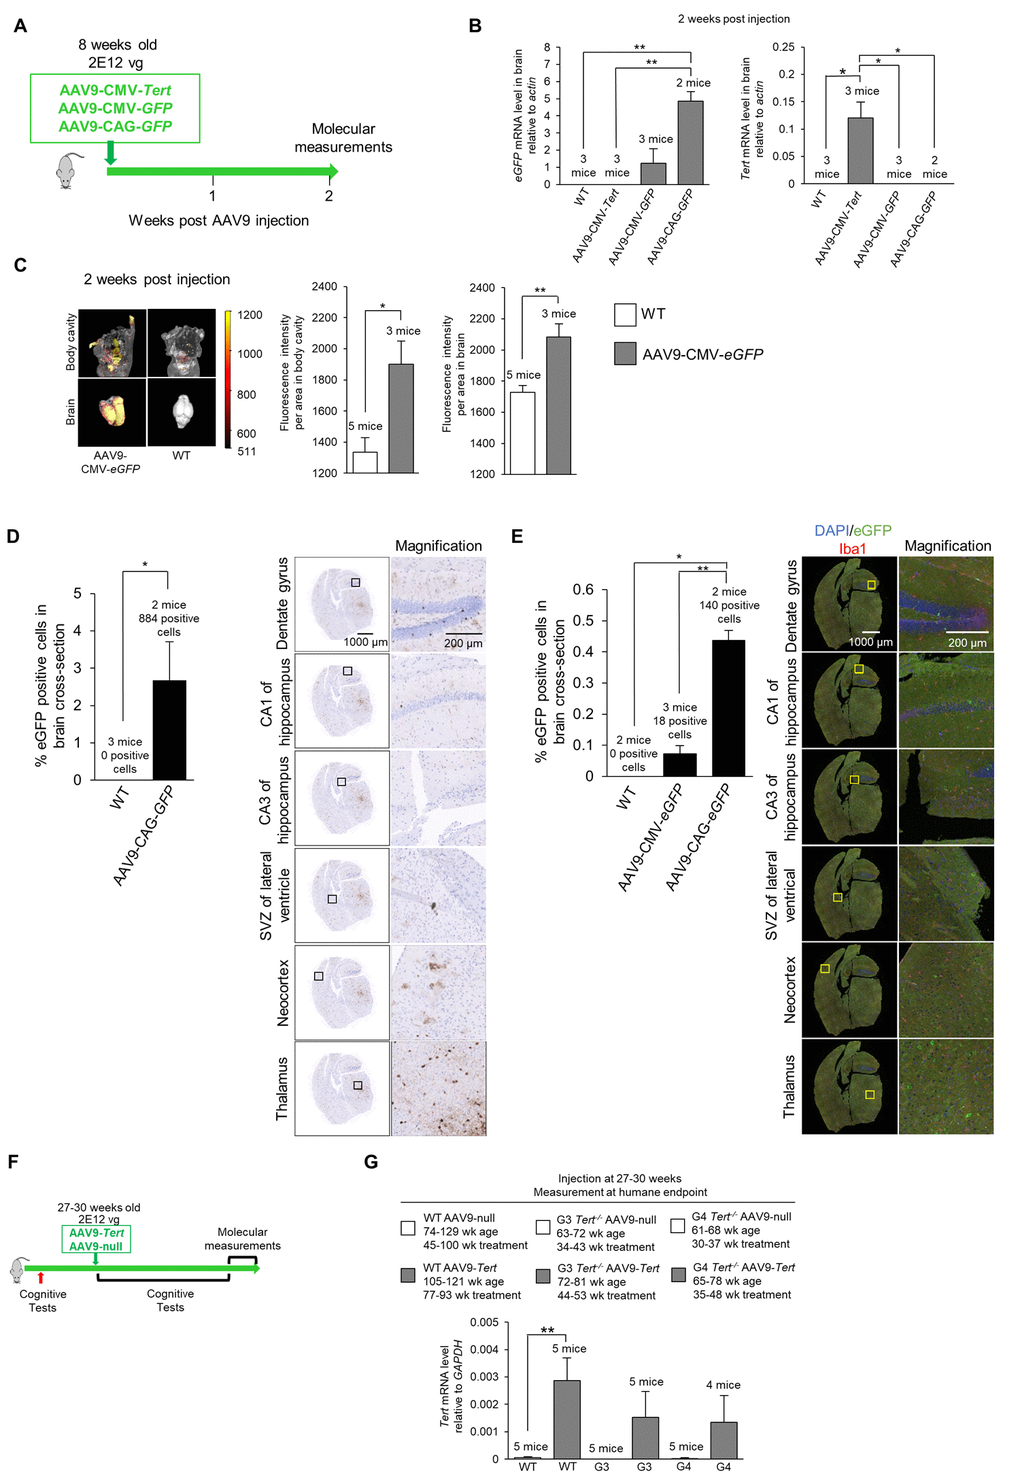
Figure 4.Experiment scheme and confirmation of virus transduction in the brain. (A) Scheme of the gene therapy experiment. Wild-type mice (8-week old) were injected IV with AAV9-CMV-Tert, AAV9-CMV-eGFP, or AAV9-CAG-eGFP, and sacrificed 2 weeks after injection. (B) Level of eGFP and Tert mRNA relative to actin in the brain as measured by qPCR 2 weeks post IV tail injection with 2E12 vg of AAV9-CMV-Tert, AAV9-CMV-eGFP, AAV9-CAG-eGFP, or no virus. (C) Quantification and representative images of fluorescence as measured by an IVIS instrument in the body and brain of wild-type mice and mice injected IV in the tail with AAV9-CMV-eGFP. (D) Quantification and representative images of eGFP positive cells in the brain as measured by immunohistochemistry in mice injected in the tail with 2E12 vg AAV9-CAG-eGFP or no virus. The percentage of eGFP positive cells was calculated from the whole coronal brain cross-section. The representative images show multiple regions throughout the brain as labelled. (E) Quantification and representative images of eGFP positive cells in the brain as measured by immunofluorescence in mice injected IV in the tail with 2E12 vg AAV9-CMV-eGFP, AAV9-CAG-eGFP, or no virus. The percentage of eGFP positive cells was calculated from the whole coronal brain cross-section. The representative images show multiple regions throughout the brain as labelled with DAPI stained nuclei in blue, eGFP in green, and Iba1 for microglia in red. (F) Scheme of experiment with injection of AAV9-Tert into young mice. The mice (wild-type, G3 Tert-/-, and G4 Tert-/- mice) were treated at a young age (27-30 weeks) by the IV tail injection of 2E12 vg of AAV9-Tert or AAV9-null virus. (G) The mRNA level of Tert in the brain at the humane endpoint. The mRNA level was measured by qPCR relative to GAPDH. The ages of the mice as well as the number of weeks of treatment for each group are indicated above the graph. Data represent the mean ±SE of analyzed mice within each group. The number of mice analyzed per group is indicated. The t-test was used for statistical analysis. *p<0.05; **p<0.01.