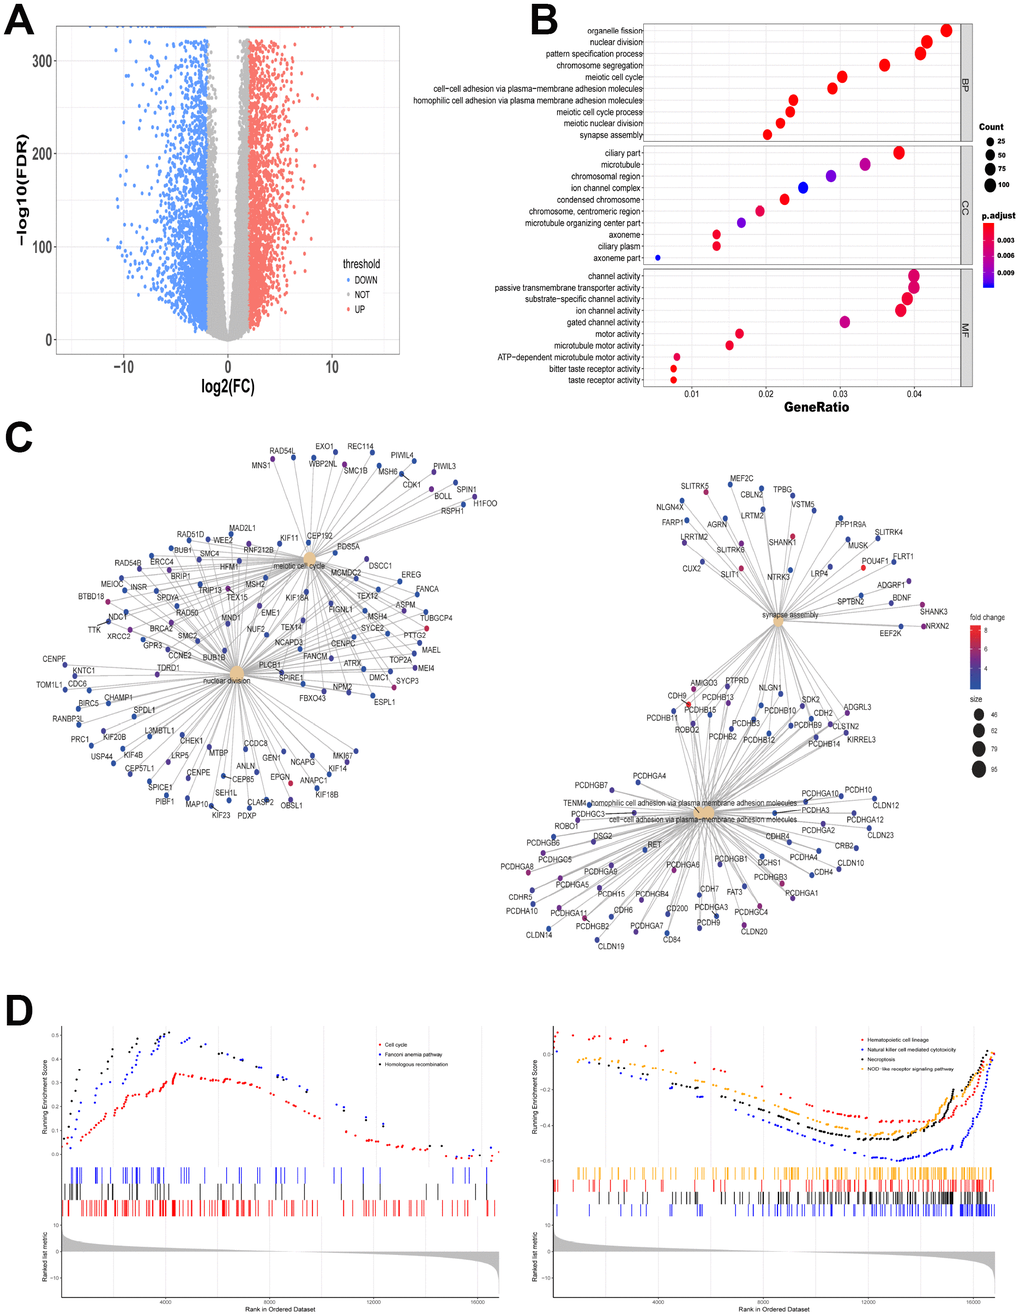
Figure 1.Different gene expression from data between TCGA and GTEx is analyzed. (A) Volcano map of significantly different expression of mRNAs. Red spots represent up-regulated genes, and blue spots represent down-regulated genes. (B) Information from up-regulated genes was applied to GO analysis in BP, CC and MF. (C) Gene symbols and interaction of the significantly up-regulated mRNAs in BP were shown. (D) KEGG-GSEA was applied for signaling pathway analysis.