Submit an Article
Navigate
Home
Editorial Board
Editorial Policies
Current Volume
Archive
Scientific Integrity
Publication Ethics Statements
Interviews with Outstanding Authors
Newsroom
Sponsored Conferences
Podcast
Contact
Special Collections
Submit an Article
Online ISSN: 1945-4589
Research Paper
|
Volume 11, Issue 11
|
pp. 3716–3730
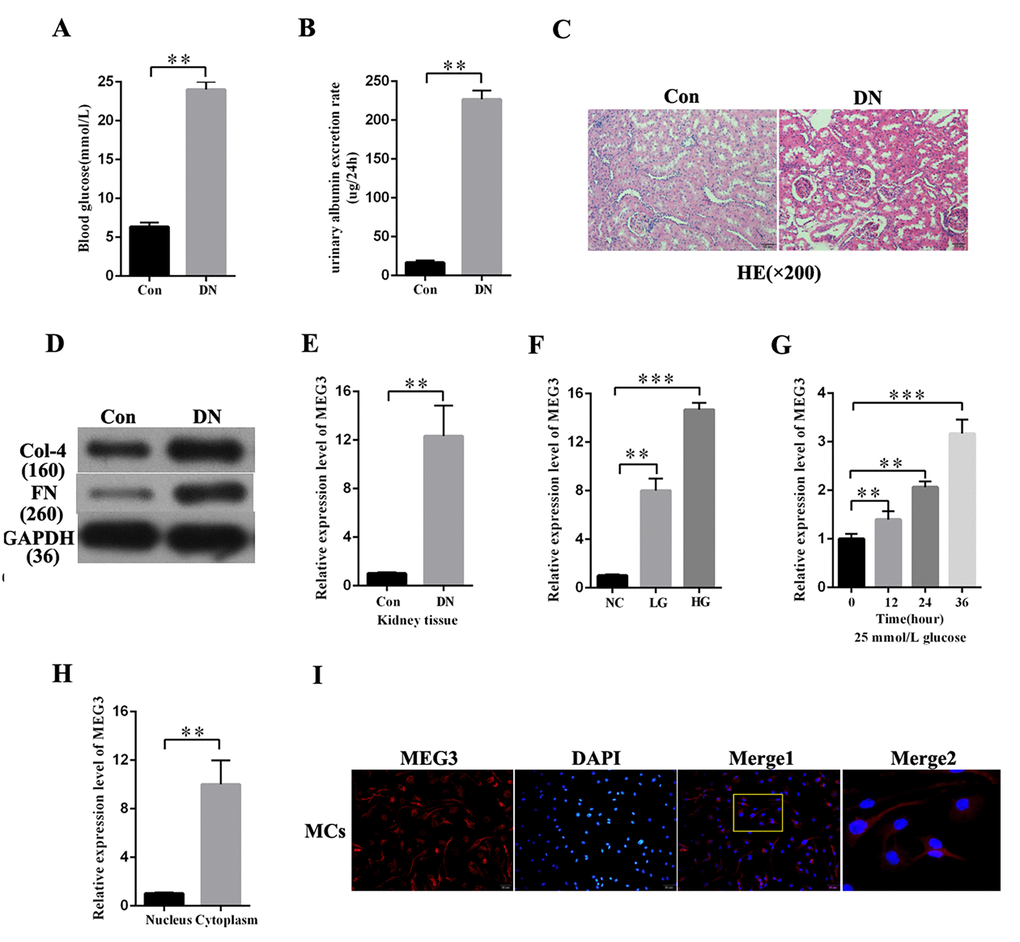
Long non-coding RNA MEG3 promotes fibrosis and inflammatory response in diabetic nephropathy via miR-181a/Egr-1/TLR4 axis
Back to article
Figure 1
(1 of 9)
−
100%
+