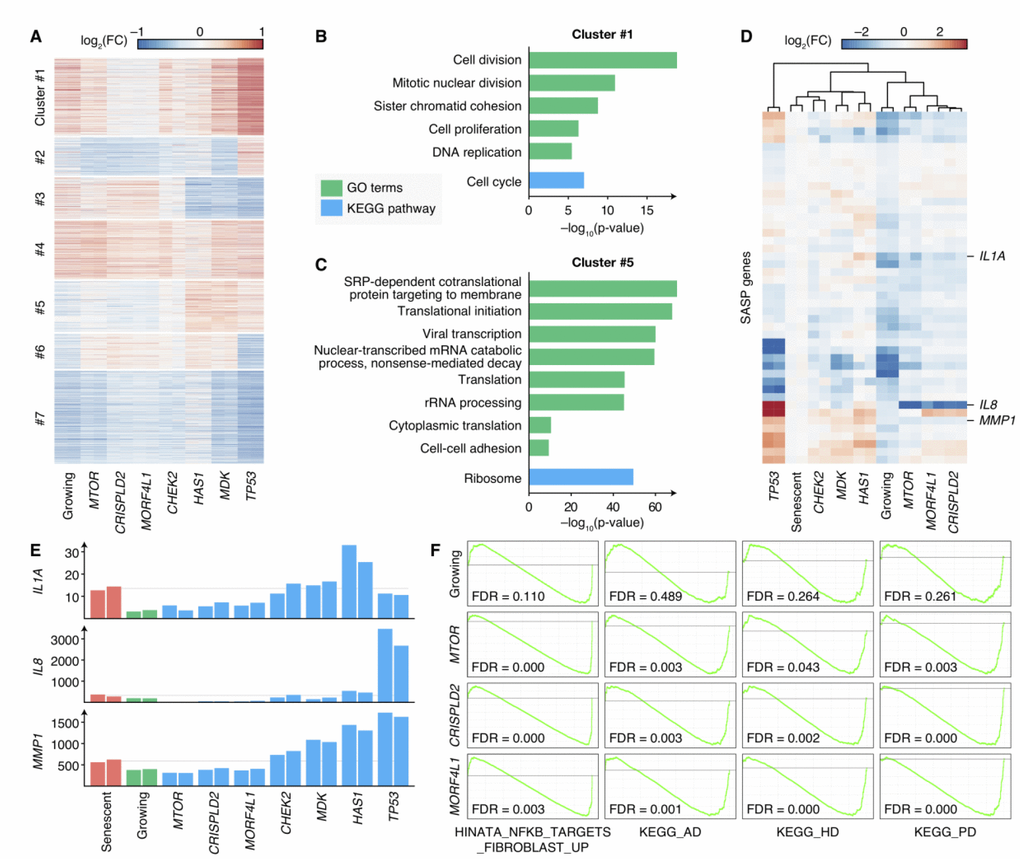
Figure 4.Transcriptomes of senescence bypass cells exhibited different patterns. (A) Fold changes of gene expressions of the senescence bypass cells compared with senescent cells. All differential expression genes (adjusted p-value < 0.05) between senescent samples and samples knocking-out validated genes were shown. Genes were clustered by k-means methods with k = 7. (B–C) KEGG pathway and GO enrichment results of genes in Cluster 1 and Cluster 5 respectively. Terms with adjusted p-value < 10–5 were shown. (D) Fold changes of SASP gene expression compared with senescent cells. Genes with significantly up-regulated in senescent cells compared with normal growing cells were shown (adjust p-value < 0.05). (E) Normalized expression profiles of IL1A, IL8, and MMP1 across all RNA-seq samples. Grey lines indicated the average expression in senescent samples. (F) GSEA analysis of growing, MTOR-deficiency, CRISPLD2-deficiency, and MORF4L1-deficiency samples in the geneset up-regulated by NF-κB (HINATA_NFKB_TARGETS_FIBROBLAST_UP), KEGG pathways of Alzheimer’s disease (KEGG_AD), Huntington’s disease (KEGG_HD), and Parkinson’s disease (KEGG_PD). GSEA was performed using ranked DESeq2 Wald statistics compared with senescent cells.