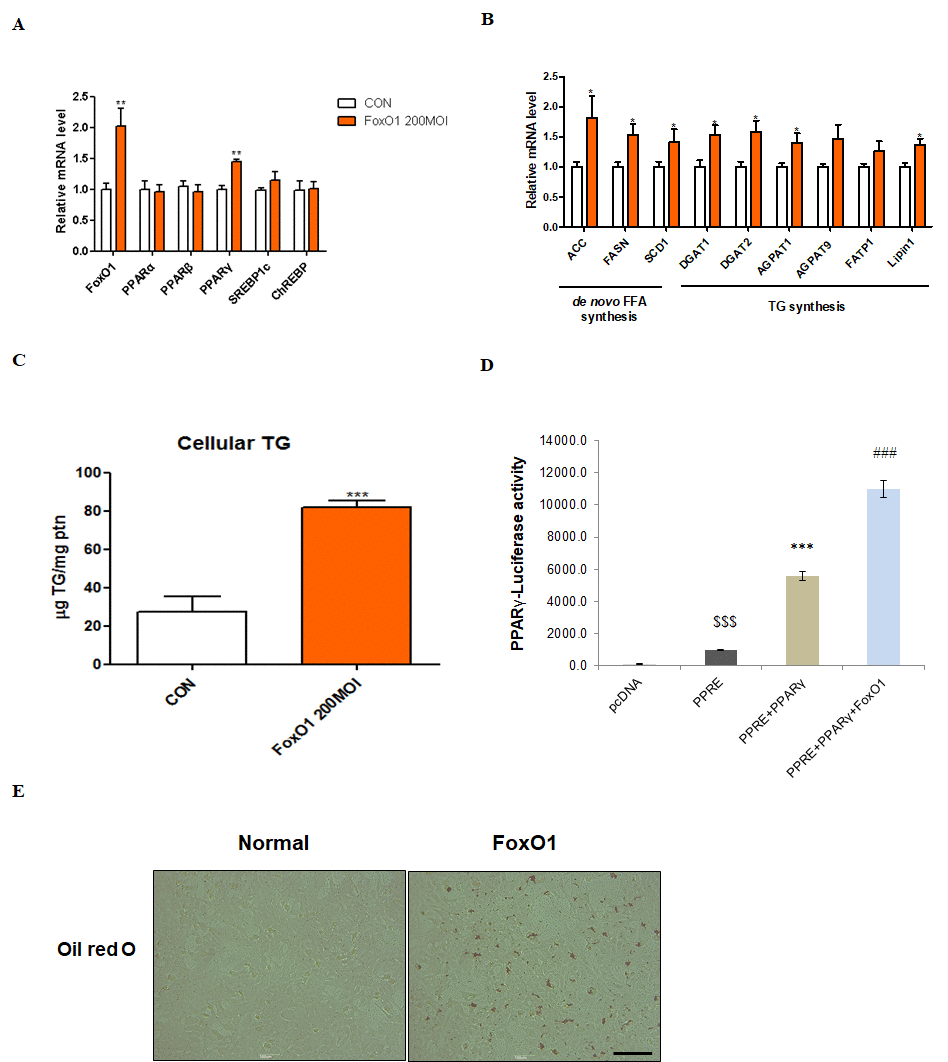
Figure 6.FoxO1-dependent changes in lipid accumulation in liver cells. (A) AC2F cells incubated with or without FoxO1 (200 MOI) for 24 h were subjected to real-time qRT–PCR analysis of different transcripts (FoxO1, PPARα, PPARβ, PPARγ, SREBP-1c, and ChREBP) by using the β-actin gene as a control. Results of one-way ANOVA: **p < 0.01 vs. untreated cells. (B) Cells incubated without or with FoxO1 (200 MOI) for 24 h were subjected to real-time qRT-PCR analysis of different transcripts (ACC, FASH, SCD1, DGAT1, DGAT2, AGPAT1, AGPAT9, FATP1, and lipin1) by using the β-actin gene as a control. Results of one-way ANOVA: *p < 0.05 vs. untreated cells. (C) Cellular triglyceride concentration was measured by a colorimetric assay. The data are expressed as a mean ± SEM. Three independent experiments were performed, providing similar results. ***p < 0.001 vs. untreated cells. (D) Effect of wild-type FoxO1 on the activity of the PPARγ promoter. AC2F cells in 48-well microplates were transduced with AdV-FoxO1 or control AdV-null vectors at a fixed dose (MOI, 200 pfu/cell), followed by transfection with 1 μg of pcDNA and PPARγ DNA in the culture medium. After a 24 h incubation, the cells were harvested. The relative luciferase activity was calculated based on the PPARγ-luciferase/β-galactosidase activity ratio. The data are expressed as a mean ± SEM. Three independent experiments were performed and similar results were obtained. $$$p < 0.001 vs. pcDNA treated cells; ***p < 0.001 vs. PPRE treated cells; ###p < 0.001 vs. PPRE with PPARγ DNA treated cells. (E) FoxO1 transfected cells were stained with Oil red O to visualize lipid accumulation. Scale bar: 100 μm.