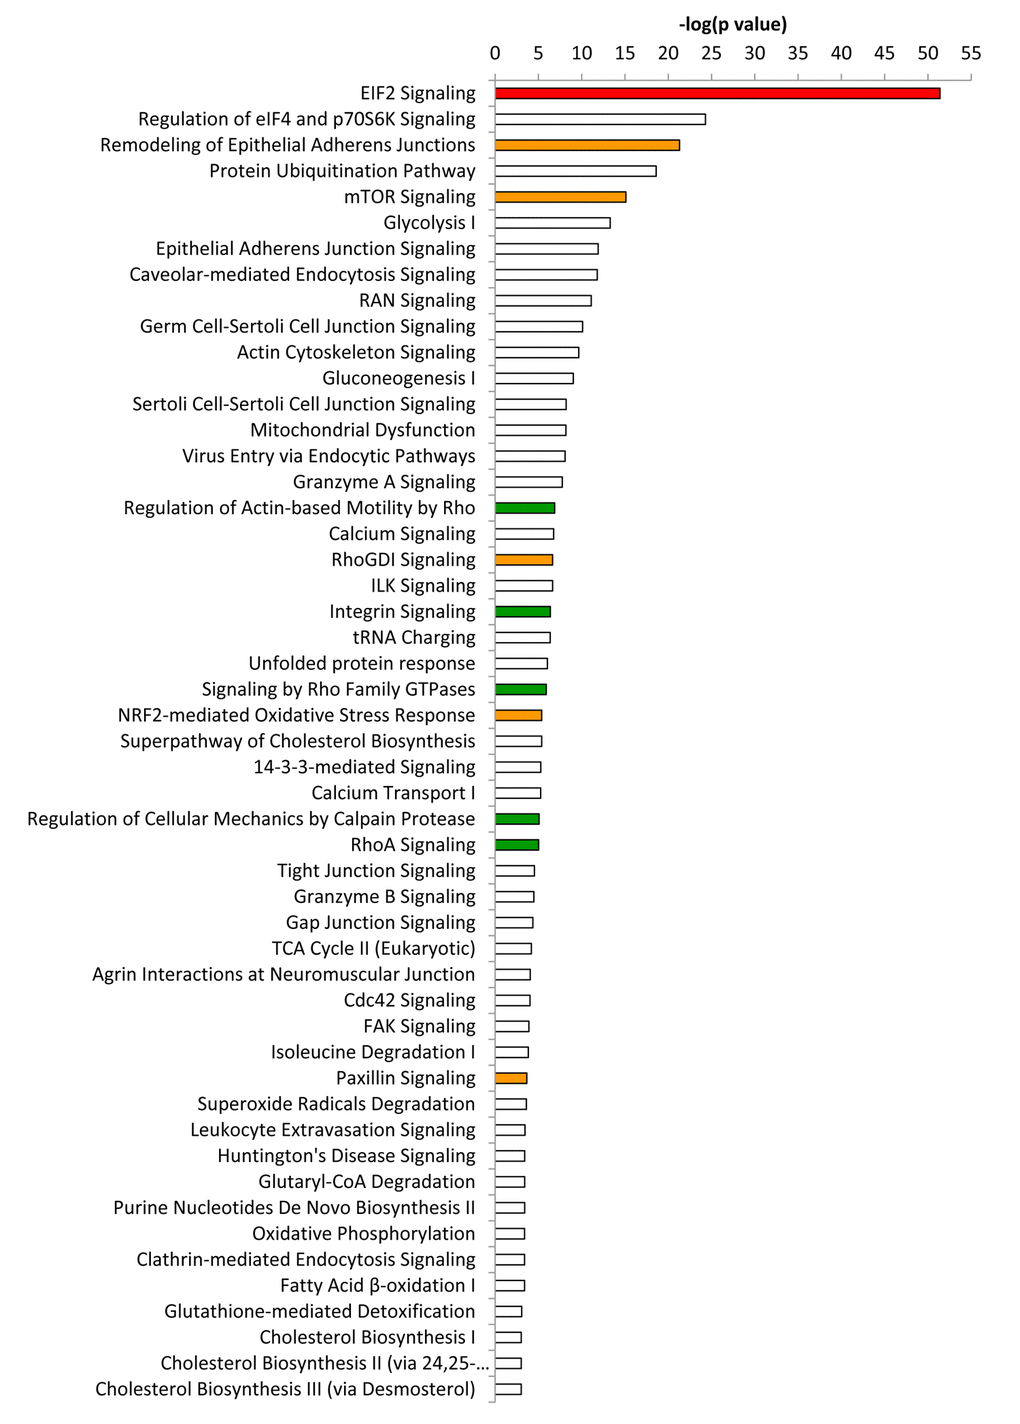
Figure 3.Ingenuity pathway analysis of differentially expressed proteins in co‐cultures compared to mixed cell populations. Ingenuity Pathway Analysis (IPA) showed canonical pathways significantly altered (p < 0.001). The p value for each pathway is indicated by the bar and is expressed as ‐1 times the log of the p value. Red colored bars indicate a predicted significant activation of the pathway (z‐score >2), whereas orange colored bars indicate a not significant activation (z‐score between 0 and 2). Green bars indicate a not significant inhibition of the pathway (z‐score between 0 and ‐2). White bars indicate that the pathway is altered, but it was not possible to predict whether it is activated nor inhibited.