Submit an Article
Navigate
Home
Editorial Board
Editorial Policies
Current Volume
Archive
Scientific Integrity
Publication Ethics Statements
Interviews with Outstanding Authors
Newsroom
Sponsored Conferences
Podcast
Contact
Special Collections
Submit an Article
Online ISSN: 1945-4589
Research Paper
|
Volume 11, Issue 13
|
pp. 4521–4535
Genome-wide association study identifies CD1A associated with rate of increase in plasma neurofilament light in non-demented elders
Back to article
Figure 3
(3 of 3)
−
100%
+
Figure 3.
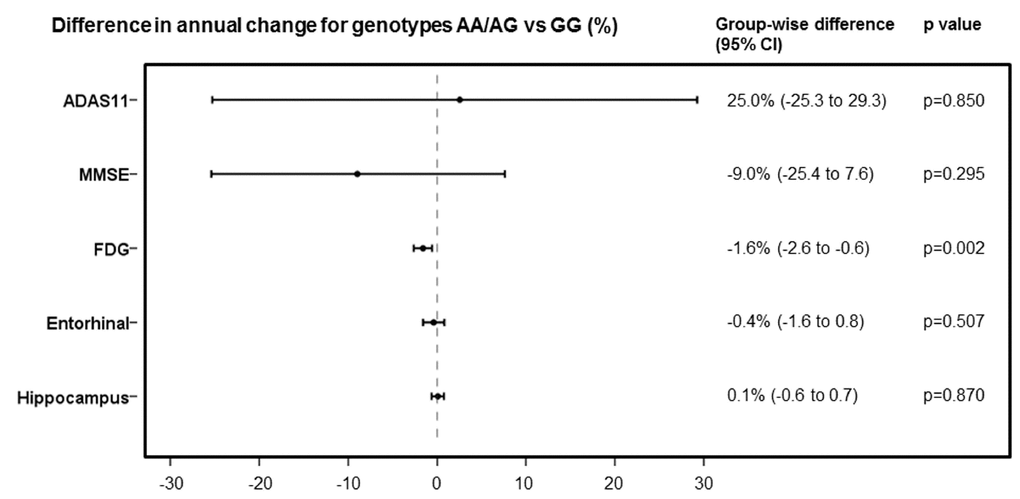
Comparison of rates of change in ADAS11, MMSE, FDG, entorhinal cortex volume and hippocampus volume, expressed as differences in annual percentage changes, with 95% CIs, between AA/AG and GG genotypes.