


Introduction
Neurofilament light (NFL) is gaining increasing attention as a potential biomarker of neuroaxonal injury which is the pathological substrate for permanent disability in various neurodegenerative diseases. Regardless of clinical diagnosis, high levels of NFL are general indicators of axonal damage. Accumulating evidence has indicated that the plasma NFL is useful for predicting and monitoring progression in various neurodegenerative diseases, including Alzheimer’s disease (AD) [1]. Increase in plasma NFL is well established in neurodegenerative pathology, but the genetic contribution to this change needs further research [2–4]. Previous studies suggested that the candidate biomarkers can be used as endophenotypes in genome-wide association study (GWAS) [5–7]. In a previous study, baseline plasma NFL data were used to explore genetic factors [8]. Since inter-individual variability may exist in the disease trajectories, cross-sectional data have limitations with respect to the evaluation of clinical disease progression. Longitudinal changes in plasma NFL may provide important insights into genetic mechanism underlying these diseases. All samples from the subjects in Alzheimer’s Disease Neuroimaging Initiative (ADNI) cohort were measured longitudinally for changes in plasma NFL levels. Thus, we can use the plasma NFL to carry out longitudinal tracking of AD-related indicators over extended periods of time. In this study, we present the first GWAS of the rate of change in plasma NFL among non-demented elders (cognitive normals (CN) or those diagnosed with mild cognitive impairment (MCI)). We hope to identify novel variants specific to the longitudinal changes in plasma NFL levels.
Results
Characteristics of included subjects
After quality control (QC), 545 non-Hispanic white participants from the ADNI with longitudinal plasma NFL data were included. Detailed information of included subjects is presented in Table 1. All available longitudinal plasma NFL data were included in the linear mixed effects models (adjusted for age at baseline, diagnosis, and marital status). We obtained a residual plasma NFL change rate for each individual. Continuous quantitative change rates were primary outcome measures used in the genetic association studies.
Table 1. Demographic information of the studies subjects.
| Baseline diagnosis | HC | MCI | Total | ||||||||||||||||||||||||||||||||||||||||||||||||||||||||||||||||||||||||||||||||||||||||||||||||
| n | 224 | 321 | 545 | ||||||||||||||||||||||||||||||||||||||||||||||||||||||||||||||||||||||||||||||||||||||||||||||||
| Age at baseline (years), mean ± SD | 74.81±5.36 | 71.69±7.35 | 72.85±6.78 | ||||||||||||||||||||||||||||||||||||||||||||||||||||||||||||||||||||||||||||||||||||||||||||||||
| Gender, male/female | 118/106 | 189/132 | 307/238 | ||||||||||||||||||||||||||||||||||||||||||||||||||||||||||||||||||||||||||||||||||||||||||||||||
| APOE4 status (0/1/2) | 80/24/2 | 172/118/31 | 340/169/36 | ||||||||||||||||||||||||||||||||||||||||||||||||||||||||||||||||||||||||||||||||||||||||||||||||
| Follow-up years, mean ± SD | 4.85±0.57 | 3.75±1.81 | 4.20±1.10 | ||||||||||||||||||||||||||||||||||||||||||||||||||||||||||||||||||||||||||||||||||||||||||||||||
| Mean annual changes in plasma NFL levels (pg/ml·year), mean ± SD | −0.11±1.56 | −0.22±1.51 | −0.17±1.51 | ||||||||||||||||||||||||||||||||||||||||||||||||||||||||||||||||||||||||||||||||||||||||||||||||
| Abbreviations: AD, Alzheimer’s disease; APOE, Apolipoprotein E; HC, healthy control; MCI, early mild cognitive impairment; NFL, neurofilament light; SD, standard deviationa. | |||||||||||||||||||||||||||||||||||||||||||||||||||||||||||||||||||||||||||||||||||||||||||||||||||
Single nucleotide polymorphisms (SNPs) associated with the rate of increase in plasma NFL
A total of 1,231,747 genotyped variants were included in GWAS. Three SNPs (rs16840041, p=4.50×10⁻⁸; rs2269714, p=4.50×10⁻⁸; rs2269715, p=4.83×10⁻⁸) were significantly associated with the rate of increase in plasma NFL (Figure 1A and Table 2). Other SNPs with suggestive associations are listed in Supplementary Table 1. Quantile-quantile (Q-Q) plot shows no evidence of population stratification, as most of the observed p-values do not deviate from the expected line (Supplementary Figure 3). The Haploview software was used to conduct linkage disequilibrium (LD) analysis between these SNPs. Rs16840041 was in high LD (r2>0.8) with other two SNPs (rs2269714 and rs2269715) in CD1A (Supplementary Figure 4).
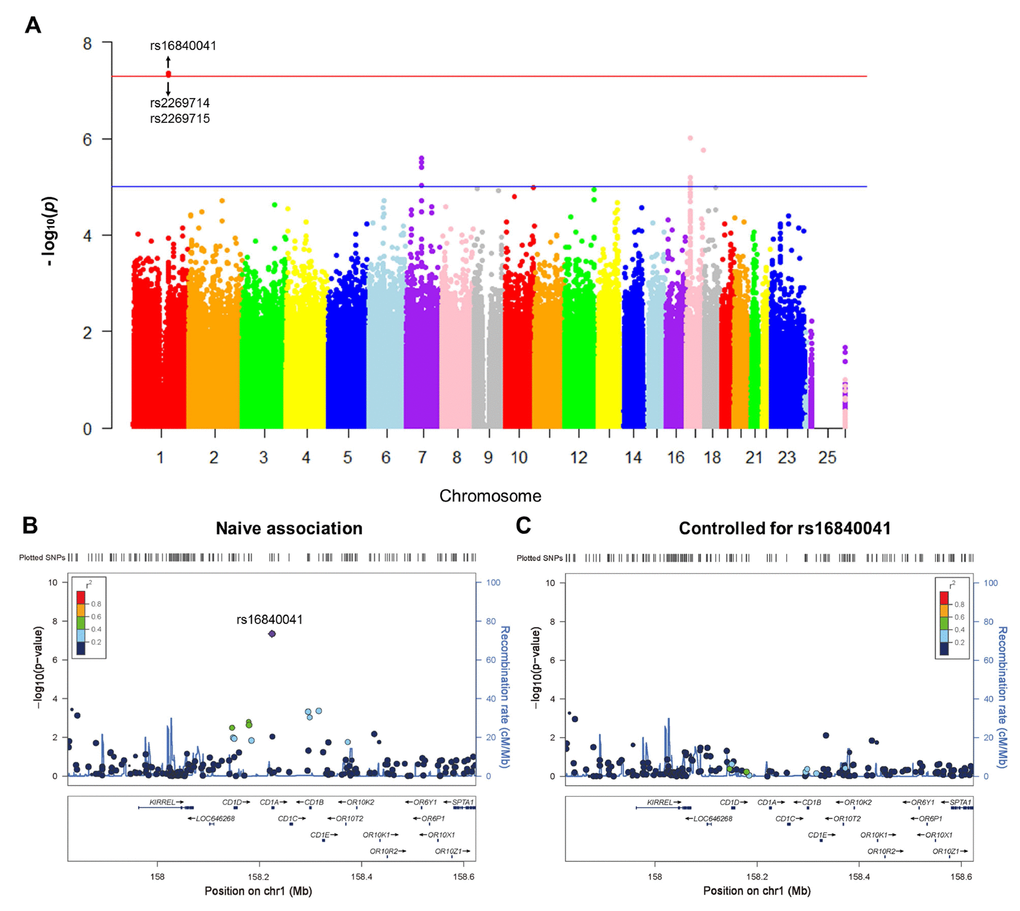
Figure 1. Genome-wide signal intensity (Manhattan) plots showing the -log10 (p value) for individual single nucleotide polymorphisms (A). Regional association results for the 158 Mb to 158.6 Mb region of chromosome 1 (B). Association results for 158 Mb to 158.6 Mb region of chromosome 1 controlling for rs16840041 (C).
Table 2. Top SNPs associated with the rate of change in plasma NFL.
| SNP | CHR | Gene | Observed MAF | SNP Type/Location | Beta | P values | |||||||||||||||||||||||||||||||||||||||||||||||||||||||||||||||||||||||||||||||||||||||||||||
| rs16840041 | 1 | CD1A | 0.06 | intron | 1.042 | 4.50×10⁻⁸ | |||||||||||||||||||||||||||||||||||||||||||||||||||||||||||||||||||||||||||||||||||||||||||||
| rs2269714 | 1 | CD1A | 0.06 | intron | 1.042 | 4.50×10⁻⁸ | |||||||||||||||||||||||||||||||||||||||||||||||||||||||||||||||||||||||||||||||||||||||||||||
| rs2269715 | 1 | CD1A | 0.06 | intron | 1.040 | 4.83×10⁻⁸ | |||||||||||||||||||||||||||||||||||||||||||||||||||||||||||||||||||||||||||||||||||||||||||||
| Abbreviations: NFL, neurofilament light; CHR, chromosome; MAF, minor allele frequency; SNP, single nucleotide polymorphism. | |||||||||||||||||||||||||||||||||||||||||||||||||||||||||||||||||||||||||||||||||||||||||||||||||||
In the CD1A region, several SNPs in LD with rs16840041 showed values of p < 0.001 for the longitudinal changes in plasma NFL (Figure 1B). However, after controlling for the genotypes of rs16840041, no strong associations remained in this region (Figure 1C), indicating that all the associations in this locus were driven by the three SNPs. Moreover, we identified that the minor allele of rs16840041-A was associated with a significant increase in plasma NFL levels (Figure 2A).
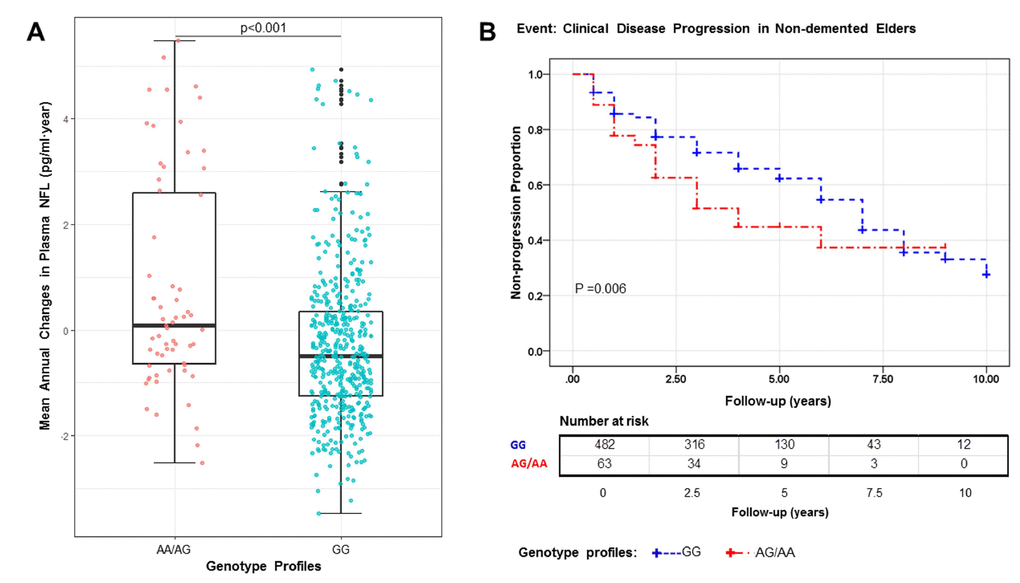
Figure 2. The A allele is associated with a significant increase in plasma NFL (P<0.001), P value in the plot was computed from linear regression model after adjusting for age, diagnosis, and APOE4 status (A). Kaplan–Meier survival curves for the probability of clinical disease progression according to different rs16840041 genotypes. Numbers of individuals at risk at each time interval are shown in the table. Survival time was calculated as the interval from the initial baseline evaluation to the clinical disease progression. AG/AA genotype is associated with an increased risk of clinical disease progression (P = 0.006) (B).
CD1A rs16840041-A affects the risk of clinical disease progression
Figure 2B shows Kaplan–Meier survival curves for the probability of clinical disease progression in the different rs16840041 genotype subgroups. The GG group was significantly associated with longer estimated time of clinical disease progression (6.26 ± 0.19 years, 95% confidence interval (CI) 5.88-6.64), compared with the AA/AG group (4.86 ± 0.50 years, 95% CI 3.90–5.82, p = 0.006). In Cox regression models (adjusted for age, diagnosis and APOE4 status), the individuals with AA/AG genotype had higher risk of progression to AD (hazard ratio 1.63, 95% CI 1.12-2.36, p = 0.010) (Supplementary Table 2).
Impact of rs16840041 on other AD-related phenotypes
In the post hoc analyses, we identified 355 subjects in all diagnostic groups with longitudinal [18F] Fluorodeoxyglucose (FDG) data available for analysis. Subjects with AA/AG genotype showed significantly faster rates of [18F] FDG decline than did those with GG genotype (AA/AG vs GG, estimate -1.6% per year [95% CI -0.6 to 2.6], p=0.0024) (adjusted for baseline age, diagnosis, and APOE4 status). But for 11-item Alzheimer's Disease Assessment Scale (ADAS11), Mini-Mental State Examination (MMSE), and the volume of AD-related brain regions, we did not observe any significant differences in the rates of change between AA/AG and GG genotypes (Figure 3).
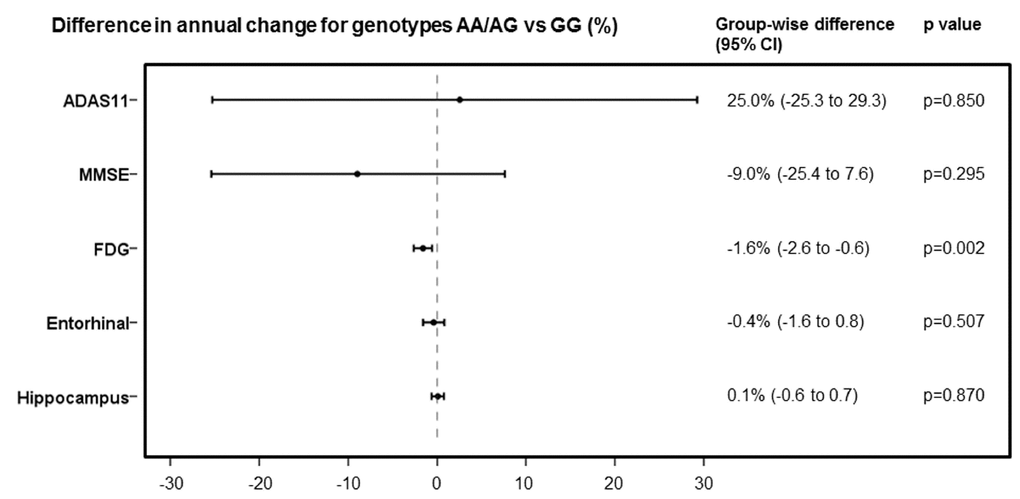
Figure 3. Comparison of rates of change in ADAS11, MMSE, FDG, entorhinal cortex volume and hippocampus volume, expressed as differences in annual percentage changes, with 95% CIs, between AA/AG and GG genotypes.
Discussion
In this study, we identified significant associations between genetic variants and the rates of change in plasma NFL among non-demented elders. Three SNPs (rs16840041, rs2269714 and rs2269715) within CD1A in high LD were associated with increased plasma NFL levels. In the other longitudinal frameworks, individuals with the minor alleles showed a higher risk of cognitive decline, and the minor alleles (rs16840041, A; rs2269714, T; rs2269715, G) were significantly associated with an accelerated decline of [18F] FDG in the entire cohort.
The three variations are located on chromosome 1q23.1 within CD1A region. The CD1A gene encodes a member of the CD1 family (CD1A, CD1B, CD1C, CD1D, and CD1E) of transmembrane glycoproteins [9]. CD1A proteins are important molecules presenting glycolipid and lipid antigens of microbial origin or themselves to T cells [10, 11]. Thus, T cells can sense and respond to changes in lipid repertoire (inflammation, infection and malignancies) [12].
Self-reactive T cells (specific for self-glycosphingolipids) were identified in multiple sclerosis (MS) patients. These T cells were restricted by all types of CD1 molecules [13]. CD1A expression was significantly increased in MS patients [14, 15]. Moreover, Caporale et al.’ study suggested that CD1A gene polymorphisms are associated with susceptibility to MS [16]. The increased CD1A expression can cause inappropriate presentation of self-lipid antigen and may be one of the pathogenetic mechanisms leading to MS. In addition to self-proteins, self-glycolipids may represent the potential source of autoantigens recognized by T cells in autoimmune diseases [13]. Once activated, CD1self-reactive T cells could regulate both cell-mediated and humoral immune responses [17]. It has been reported that several autoimmune diseases and neurodegenerative diseases (AD, Parkinson disease (PD), and frontotemporal dementia (FTD)) share the same genetic pathways [18–20].
Previous studies have identified that the minor allele (T) of rs2269714 elevated the expression levels of CD1A in blood samples [21]. The elevated expression of CD1A was associated with peripheral inflammation (skin inflammation, ulcerative colitis, and rheumatoid arthritis, etc.) [22–24]. Secreted by CD1A-reactive T cells, a variety of cytokines (IL-13, IL-22, IL-17A, TNF-α, IFN-γ and GM-CSF et al.) participated ininflammation, wound healing and defense against infection [24–26]. Inflammatory mediators or cytokines that are induced at the site of inflammation can enter the blood. These inflammatory signals could spread into central nervous system (CNS) through microglia [27]. Macrophages and microglia (cells of the mononuclear phagocyte lineage) play key roles in inflammation of chronic neurodegenerative disease [28]. It has been reported that peripheral immune stimuli can lead to differential epigenetic reprogramming of macrophages and microglia, cause long-term alterations in the brain immune response, and then affect the severity of miscellaneous neurodegenerative diseases, including AD [29]. Interestingly, this immune memory can also be elicited by individual cytokines [29]. In miscellaneous neurodegenerative diseases (AD, PD, and amyotrophic lateral sclerosis (ALS)), neuroinflammation is typified by a reactive morphology of glial cells (astrocytes and microglia) [30]. Moreover, the roles of peripheral inflammation in the development of multi-infarct dementia and AD have also been reported [31]. In summary, previous studies have indicated that the CD1A-related immune activation and peripheral inflammation may be important mechanisms contributing to neurodegenerative diseases.
As an important neuroimaging biomarker of metabolic abnormalities, [18F] FDG-PET can reflect the magnitude of cerebral hypometabolism [32]. Peripheral inflammation has been reported to reduce glucose metabolism in human medial temporal lobe (MTL) and impair human spatial memory [33]. But the molecular mechanism through which rs16840041 could affect human MTL function has not been studied yet. The decline rates of [18F] FDG were significantly associated with minor allele (A), further indicating the potential role of these SNPs in neurodegenerative diseases. Moreover, previous studies suggested that anti-CD1a antibody can reduce inflammation, indicating that blocking the interaction of CD1a with receptors on T cells could be a potential treatment for neurodegenerative diseases [34]. While the specific biological pathways underlying the role of CD1A in the vulnerability of neurodegenerative diseases require further investigation, the results reported here suggest that CD1A may be important for monitoring dementia progression at the individual level and evaluating early indicators of dementia. Moreover, those results also suggest that CD1A should be considered as a potential therapeutic target in dementia.
Limitations
Several potential limitations of this report are as follows. First, the GWAS was conducted with modest samples sizes which restricted stratified analyses for each diagnostic group. Furthermore, we didn’t replicate these findings in an independent cohort due to limited data. Third, our sample was restricted to non-Hispanic white participants. We didn't explore the diversity among different populations.
Methods
ADNI dataset
All participants were from the ADNI database which included three protocols (ADNI 1, ADNI 2 and ADNI Grand Opportunities (ADNI GO)). The ADNI database has recruited more than 1500 participants, including normal, MCI and AD subjects at present. ADNI was launched in 2003 by the National Institute on Aging, the National Institute of Biomedical Imaging and Bioengineering, the Food and Drug Administration, private pharmaceutical companies and nonprofit organizations. ADNI data (MRI and PET images, genetics, cognitive tests, and data on cerebrospinal fluid (CSF) and blood biomarkers) are disseminated by the Laboratory for Neuro Imaging at the University of Southern California. Informed consent was obtained from study participants, and the study was approved by the local institutional review board at each participating site. More information is available on the website of ADNI (http://adni.loni.usc.edu/).
Participants
In this study, 545 subjects (healthy controls (HC) 224, MCI 321 at baseline) whose data met all QC criteria were included from the ADNI cohort. The demographic data and rate of change in plasma NFL in each group were summarized in Table 1.
The full cohort with GWS data and at least one follow-up for plasma NFL data included 614 participants. All the analyses were restricted to non-Hispanic white participants (n=559) to reduce the potential bias from population stratification. Population substructure and cryptic relatedness were checked with genomic identity-by-descent and multidimensional scaling (MDS) components and 5 participants were removed (Supplementary Figure 1). The QC of the rate of change in plasma NFL resulted in 545 valid samples. Moreover, ADNI samples showed tight clustering with individuals of European ancestry in MDS plot overlaid on HapMap samples (Supplementary Figure 2).
Plasma measurements and QC
Plasma NFL was analyzed using the ultrasensitive Single Molecule array (Simoa) technique as previously described [35]. The assay used a combination of monoclonal antibodies and purified bovine NFL as a calibrator. Analytical sensitivity was < 1.0 pg/mL, and the NFL levels in all tested samples were above the detection limit. Changes in the NFL levels of the subjects were measured longitudinally. Further QC was performed to reduce the potential influence of extreme outliers on statistical results. Mean (-0.02 pg/ml·year) and standard deviations (SD) (1.97 pg/ml·year) of longitudinal rates of change in plasma NFL levels were calculated. Participants who had extreme outliers (<3-fold or >3-fold SD from the mean value) were removed from the analysis. This step removed 9 subjects.
Genotyping and QC
The ADNI-1, ADNI-2, and ADNI-GO samples were genotyped with the Human 610-Quad BeadChip, Illumina Human Omni Express BeadChip and Ilumina Omni 2.5M BeadChip, respectively. PLINK software (version 1.07) was used in this step. The following criteria were utilized to perform a stringent QC assessment: call rates for individuals and SNPs were restricted to> 95%; minor allele frequencies (MAF) were restricted to > 0.05; p value for Hardy-Weinberg equilibrium test was restricted to > 0.001. An APOE genotyping kit was used to identify APOE alleles (polymorphisms rs7412 and rs429358) [36].
Clinical disease progression
In the longitudinal study, HC and MCI participants were classified into either stable group or group of clinical disease progression (cognitive decline). Participants were designated as having clinical disease progression if their clinical classification or global CDR/MMSE score changed (HC subjects converted to MCI or AD, or their global CDR scores rose to 0.5 or more; MCI subjects lost more than 3 points between first and last MMSE administrations, converted to AD at follow-up, or got a score less than 24 on the last MMSE) [37–39]. If the above criteria have not been met at follow-up, participants were deemed stable.
Statistical analyses
Linear mixed models were utilized to compute longitudinal rates of change in the plasma NFL levels. These models were adjusted for age (P<0.001), diagnosis (P<0.001), and marital status (P<0.001). From these models, we estimated the mean rates of change for the whole samples. Using these longitudinal rates, we then fitted linear regression models using PLINK (version 1.07) [44]. An additive genetic model (i.e., dose-dependent effect of the minor allele) was utilized in those genetic association studies. As described above, the phenotype was the plasma NFL change rates extracted from the mixed effects models after adjustment for age, diagnosis, and marital status. The association analysis was additionally adjusted for the first two principal components (PCs) calculated by genome-wide complex trait analysis (GCTA) [45]. The thresholds of p< 1×10⁻⁵ and p< 5×10⁻⁸ were used for suggestive and genome-wide significant associations respectively [46]. Genome-wide associations were visualized with the R (version 3.5.1) package qqman [47]. Regional associations were visualized with the Locus Zoom web tool [48]. The association of mean annual changes in plasma NFL and A allele was tested using a linear regression model adjusting for age, diagnosis, and APOE4 status.
Kaplan-Meier survival analysis of clinical disease progression was plotted based on rs16840041 genotypes. Log-rank test was used to compare the survival distributions of the different genotype subgroups. Cox proportional hazards models (adjusted for age, diagnosis, APOE4 status) were used to test the predictive ability of the rs16840041genotypes for clinical disease progression. Linear mixed models were also used to estimate associations between the rs16840041 genotypes and the change rates of other AD-related phenotypes. All models were fitted with the lmer function in the R lme4 package (version 1.1-18-1). Estimates and 95% CIs were based on parametric bootstrapping of the fitted models by use of the sim function in the arm package (version 1.10-1) with 10 000 replicates [49].
Conclusions
In summary, we identified the associations of the three SNPs (rs16840041, rs2269714 and rs2269715) within CD1A with the increase in plasma NFL levels, faster decline of [18F] FDG and higher risk of cognitive decline among non-demented elders. These findings provide insights into the relationship of genetic variants with change rates of plasma NFL and AD-related phenotypes. The CD1A should be further investigated as a gene of interest in neurodegenerative diseases and as a potential target for monitoring disease trajectories and treating disease.
Acknowledgments
Data used in preparation of this article were obtained from the Alzheimer’s Disease Neuroimaging Initiative (ADNI) database (http://adni.loni.usc.edu/). As such, the investigators within the ADNI contributed to the design and implementation of ADNI and/or provided data but did not participate in analysis or writing of this report. A complete listing of ADNI investigators can be found at: http://adni.loni.usc.edu/wp-content/uploads/how_to_apply/ADNI_Acknowledgement_List.pdf
Conflicts of Interest
The authors have no conflicts of interest to disclose.
Funding
This study was supported by grants from the National Natural Science Foundation of China (91849126), the National Key R&D Program of China (2018YFC1314700), Shanghai Municipal Science and Technology Major Project (No.2018SHZDZX01) and ZHANGJIANG LAB, Tianqiao and Chrissy Chen Institute, and the State Key Laboratory of Neurobiology and Frontiers Center for Brain Science of Ministry of Education, Fudan University. Data collection and sharing for this project was funded by the Alzheimer's Disease Neuroimaging Initiative (ADNI) (National Institutes of Health Grant U01 AG024904) and DOD ADNI (Department of Defense award number W81XWH-12-2-0012). ADNI is funded by the National Institute on Aging, the National Institute of Biomedical Imaging and Bioengineering, and through generous contributions from the following: AbbVie, Alzheimer’s Association; Alzheimer’s Drug Discovery Foundation; Araclon Biotech; BioClinica, Inc.; Biogen; Bristol-Myers Squibb Company; CereSpir, Inc.; Cogstate; Eisai Inc.; Elan Pharmaceuticals, Inc.; Eli Lilly and Company; EuroImmun; F. Hoffmann-La Roche Ltd and its affiliated company Genentech, Inc.; Fujirebio; GE Healthcare; IXICO Ltd.; Janssen Alzheimer Immunotherapy Research & Development, LLC.; Johnson & Johnson Pharmaceutical Research & Development LLC.; Lumosity; Lundbeck; Merck & Co., Inc.; Meso Scale Diagnostics, LLC.; NeuroRx Research; Neurotrack Technologies; Novartis Pharmaceuticals Corporation; Pfizer Inc.; Piramal Imaging; Servier; Takeda Pharmaceutical Company; and Transition Therapeutics. The Canadian Institutes of Health Research is providing funds to support ADNI clinical sites in Canada. Private sector contributions are facilitated by the Foundation for the National Institutes of Health (http://www.fnih.org). The grantee organization is the Northern California Institute for Research and Education, and the study is coordinated by the Alzheimer’s Therapeutic Research Institute at the University of Southern California. ADNI data are disseminated by the Laboratory for Neuro Imaging at the University of Southern California.
References
- 1. Khalil M, Teunissen CE, Otto M, Piehl F, Sormani MP, Gattringer T, Barro C, Kappos L, Comabella M, Fazekas F, Petzold A, Blennow K, Zetterberg H, Kuhle J. Neurofilaments as biomarkers in neurological disorders. Nat Rev Neurol. 2018; 14:577–89. https://doi.org/10.1038/s41582-018-0058-z [PubMed]
- 2. Meeter LH, Dopper EG, Jiskoot LC, Sanchez-Valle R, Graff C, Benussi L, Ghidoni R, Pijnenburg YA, Borroni B, Galimberti D, Laforce RJ, Masellis M, Vandenberghe R, et al. Neurofilament light chain: a biomarker for genetic frontotemporal dementia. Ann Clin Transl Neurol. 2016; 3:623–36. https://doi.org/10.1002/acn3.325 [PubMed]
- 3. Mattsson N, Andreasson U, Zetterberg H, Blennow K, and Alzheimer’s Disease Neuroimaging Initiative. Association of Plasma Neurofilament Light With Neurodegeneration in Patients With Alzheimer Disease. JAMA Neurol. 2017; 74:557–66. https://doi.org/10.1001/jamaneurol.2016.6117 [PubMed]
- 4. Byrne LM, Rodrigues FB, Blennow K, Durr A, Leavitt BR, Roos RA, Scahill RI, Tabrizi SJ, Zetterberg H, Langbehn D, Wild EJ. Neurofilament light protein in blood as a potential biomarker of neurodegeneration in Huntington’s disease: a retrospective cohort analysis. Lancet Neurol. 2017; 16:601–09. https://doi.org/10.1016/S1474-4422(17)30124-2 [PubMed]
- 5. Chen J, Yu JT, Wojta K, Wang HF, Zetterberg H, Blennow K, Yokoyama JS, Weiner MW, Kramer JH, Rosen H, Miller BL, Coppola G, Boxer AL, and Alzheimer’s Disease Neuroimaging Initiative. Genome-wide association study identifies MAPT locus influencing human plasma tau levels. Neurology. 2017; 88:669–76. https://doi.org/10.1212/WNL.0000000000003615 [PubMed]
- 6. Chung J, Wang X, Maruyama T, Ma Y, Zhang X, Mez J, Sherva R, Takeyama H, Lunetta KL, Farrer LA, Jun GR, and Alzheimer’s Disease Neuroimaging Initiative. Genome-wide association study of Alzheimer’s disease endophenotypes at prediagnosis stages. Alzheimers Dement. 2018; 14:623–33. https://doi.org/10.1016/j.jalz.2017.11.006 [PubMed]
- 7. Xu Z, Wu C, Pan W, and Alzheimer’s Disease Neuroimaging Initiative. Imaging-wide association study: integrating imaging endophenotypes in GWAS. Neuroimage. 2017; 159:159–69. https://doi.org/10.1016/j.neuroimage.2017.07.036 [PubMed]
- 8. Li JQ, Yuan XZ, Li HY, Cao XP, Yu JT, Tan L, Chen WA, and Alzheimer’s Disease Neuroimaging Initiative. Genome-wide association study identifies two loci influencing plasma neurofilament light levels. BMC Med Genomics. 2018; 11:47. https://doi.org/10.1186/s12920-018-0364-8 [PubMed]
- 9. Martin LH, Calabi F, Milstein C. Isolation of CD1 genes: a family of major histocompatibility complex-related differentiation antigens. Proc Natl Acad Sci USA. 1986; 83:9154–58. https://doi.org/10.1073/pnas.83.23.9154 [PubMed]
- 10. Moody DB, Young DC, Cheng TY, Rosat JP, Roura-Mir C, O’Connor PB, Zajonc DM, Walz A, Miller MJ, Levery SB, Wilson IA, Costello CE, Brenner MB. T cell activation by lipopeptide antigens. Science. 2004; 303:527–31. https://doi.org/10.1126/science.1089353 [PubMed]
- 11. Zajonc DM, Elsliger MA, Teyton L, Wilson IA. Crystal structure of CD1a in complex with a sulfatide self antigen at a resolution of 2.15 A. Nat Immunol. 2003; 4:808–15. https://doi.org/10.1038/ni948 [PubMed]
- 12. de Jong A. Activation of human T cells by CD1 and self-lipids. Immunol Rev. 2015; 267:16–29. https://doi.org/10.1111/imr.12322 [PubMed]
- 13. Shamshiev A, Donda A, Carena I, Mori L, Kappos L, De Libero G. Self glycolipids as T-cell autoantigens. Eur J Immunol. 1999; 29:1667–75. https://doi.org/10.1002/(SICI)1521-4141(199905)29:05<1667::AID-IMMU1667>3.0.CO;2-U [PubMed]
- 14. Huang YM, Kouwenhoven M, Jin YP, Press R, Huang WX, Link H. Dendritic cells derived from patients with multiple sclerosis show high CD1a and low CD86 expression. Mult Scler. 2001; 7:95–99. https://doi.org/10.1177/135245850100700204 [PubMed]
- 15. Cipriani B, Chen L, Hiromatsu K, Knowles H, Raine CS, Battistini L, Porcelli SA, Brosnan CF. Upregulation of group 1 CD1 antigen presenting molecules in guinea pigs with experimental autoimmune encephalomyelitis: an immunohistochemical study. Brain Pathol. 2003; 13:1–9. https://doi.org/10.1111/j.1750-3639.2003.tb00001.x [PubMed]
- 16. Caporale CM, Notturno F, Pace M, Aureli A, Di Tommaso V, De Luca G, Farina D, Giovannini A, Uncini A. CD1A and CD1E gene polymorphisms are associated with susceptibility to multiple sclerosis. Int J Immunopathol Pharmacol. 2011; 24:175–83. https://doi.org/10.1177/039463201102400120 [PubMed]
- 17. de Lalla C, Lepore M, Piccolo FM, Rinaldi A, Scelfo A, Garavaglia C, Mori L, De Libero G, Dellabona P, Casorati G. High-frequency and adaptive-like dynamics of human CD1 self-reactive T cells. Eur J Immunol. 2011; 41:602–10. https://doi.org/10.1002/eji.201041211 [PubMed]
- 18. Yokoyama JS, Wang Y, Schork AJ, Thompson WK, Karch CM, Cruchaga C, McEvoy LK, Witoelar A, Chen CH, Holland D, Brewer JB, Franke A, Dillon WP, et al, and Alzheimer’s Disease Neuroimaging Initiative. Association Between Genetic Traits for Immune-Mediated Diseases and Alzheimer Disease. JAMA Neurol. 2016; 73:691–97. https://doi.org/10.1001/jamaneurol.2016.0150 [PubMed]
- 19. Witoelar A, Jansen IE, Wang Y, Desikan RS, Gibbs JR, Blauwendraat C, Thompson WK, Hernandez DG, Djurovic S, Schork AJ, Bettella F, Ellinghaus D, Franke A, et al, and International Parkinson’s Disease Genomics Consortium (IPDGC), North American Brain Expression Consortium (NABEC), and United Kingdom Brain Expression Consortium (UKBEC) Investigators. Genome-wide Pleiotropy Between Parkinson Disease and Autoimmune Diseases. JAMA Neurol. 2017; 74:780–92. https://doi.org/10.1001/jamaneurol.2017.0469 [PubMed]
- 20. Broce I, Karch CM, Wen N, Fan CC, Wang Y, Tan CH, Kouri N, Ross OA, Höglinger GU, Muller U, Hardy J, Momeni P, Hess CP, et al, and International FTD-Genomics Consortium. Immune-related genetic enrichment in frontotemporal dementia: an analysis of genome-wide association studies. PLoS Med. 2018; 15:e1002487. https://doi.org/10.1371/journal.pmed.1002487 [PubMed]
- 21. Westra HJ, Peters MJ, Esko T, Yaghootkar H, Schurmann C, Kettunen J, Christiansen MW, Fairfax BP, Schramm K, Powell JE, Zhernakova A, Zhernakova DV, Veldink JH, et al. Systematic identification of trans eQTLs as putative drivers of known disease associations. Nat Genet. 2013; 45:1238–43. https://doi.org/10.1038/ng.2756 [PubMed]
- 22. Kim JH, Hu Y, Yongqing T, Kim J, Hughes VA, Le Nours J, Marquez EA, Purcell AW, Wan Q, Sugita M, Rossjohn J, Winau F. CD1a on Langerhans cells controls inflammatory skin disease. Nat Immunol. 2016; 17:1159–66. https://doi.org/10.1038/ni.3523 [PubMed]
- 23. Al-Amodi O, Jodeleit H, Beigel F, Wolf E, Siebeck M, Gropp R. CD1a-Expressing Monocytes as Mediators of Inflammation in Ulcerative Colitis. Inflamm Bowel Dis. 2018; 24:1225–36. https://doi.org/10.1093/ibd/izy073 [PubMed]
- 24. Cheung KL, Jarrett R, Subramaniam S, Salimi M, Gutowska-Owsiak D, Chen YL, Hardman C, Xue L, Cerundolo V, Ogg G. Psoriatic T cells recognize neolipid antigens generated by mast cell phospholipase delivered by exosomes and presented by CD1a. J Exp Med. 2016; 213:2399–412. https://doi.org/10.1084/jem.20160258 [PubMed]
- 25. Jarrett R, Salio M, Lloyd-Lavery A, Subramaniam S, Bourgeois E, Archer C, Cheung KL, Hardman C, Chandler D, Salimi M, Gutowska-Owsiak D, de la Serna JB, Fallon PG, et al. Filaggrin inhibits generation of CD1a neolipid antigens by house dust mite-derived phospholipase. Sci Transl Med. 2016; 8:325ra18. https://doi.org/10.1126/scitranslmed.aad6833 [PubMed]
- 26. de Jong A, Peña-Cruz V, Cheng TY, Clark RA, Van Rhijn I, Moody DB. CD1a-autoreactive T cells are a normal component of the human αβ T cell repertoire. Nat Immunol. 2010; 11:1102–09. https://doi.org/10.1038/ni.1956 [PubMed]
- 27. Laflamme N, Rivest S. Effects of systemic immunogenic insults and circulating proinflammatory cytokines on the transcription of the inhibitory factor kappaB alpha within specific cellular populations of the rat brain. J Neurochem. 1999; 73:309–21. https://doi.org/10.1046/j.1471-4159.1999.0730309.x [PubMed]
- 28. Li Q, Barres BA. Microglia and macrophages in brain homeostasis and disease. Nat Rev Immunol. 2018; 18:225–42. https://doi.org/10.1038/nri.2017.125 [PubMed]
- 29. Wendeln AC, Degenhardt K, Kaurani L, Gertig M, Ulas T, Jain G, Wagner J, Häsler LM, Wild K, Skodras A, Blank T, Staszewski O, Datta M, et al. Innate immune memory in the brain shapes neurological disease hallmarks. Nature. 2018; 556:332–38. https://doi.org/10.1038/s41586-018-0023-4 [PubMed]
- 30. Ransohoff RM. How neuroinflammation contributes to neurodegeneration. Science. 2016; 353:777–83. https://doi.org/10.1126/science.aag2590 [PubMed]
- 31. De Luigi A, Pizzimenti S, Quadri P, Lucca U, Tettamanti M, Fragiacomo C, De Simoni MG. Peripheral inflammatory response in Alzheimer’s disease and multiinfarct dementia. Neurobiol Dis. 2002; 11:308–14. https://doi.org/10.1006/nbdi.2002.0556 [PubMed]
- 32. Lan MJ, Ogden RT, Kumar D, Stern Y, Parsey RV, Pelton GH, Rubin-Falcone H, Pradhaban G, Zanderigo F, Miller JM, Mann JJ, Devanand DP. Utility of Molecular and Structural Brain Imaging to Predict Progression from Mild Cognitive Impairment to Dementia. J Alzheimers Dis. 2017; 60:939–47. https://doi.org/10.3233/JAD-161284 [PubMed]
- 33. Harrison NA, Doeller CF, Voon V, Burgess N, Critchley HD. Peripheral inflammation acutely impairs human spatial memory via actions on medial temporal lobe glucose metabolism. Biol Psychiatry. 2014; 76:585–93. https://doi.org/10.1016/j.biopsych.2014.01.005 [PubMed]
- 34. Cully M. Inflammatory diseases: Anti-CD1a antibody reduces inflammation in psoriasis. Nat Rev Drug Discov. 2016; 15:678. https://doi.org/10.1038/nrd.2016.192 [PubMed]
- 35. Rohrer JD, Woollacott IO, Dick KM, Brotherhood E, Gordon E, Fellows A, Toombs J, Druyeh R, Cardoso MJ, Ourselin S, Nicholas JM, Norgren N, Mead S, et al. Serum neurofilament light chain protein is a measure of disease intensity in frontotemporal dementia. Neurology. 2016; 87:1329–36. https://doi.org/10.1212/WNL.0000000000003154 [PubMed]
- 36. Kim S, Swaminathan S, Shen L, Risacher SL, Nho K, Foroud T, Shaw LM, Trojanowski JQ, Potkin SG, Huentelman MJ, Craig DW, DeChairo BM, Aisen PS, et al, and Alzheimer’s Disease Neuroimaging Initiative. Genome-wide association study of CSF biomarkers Abeta1-42, t-tau, and p-tau181p in the ADNI cohort. Neurology. 2011; 76:69–79. https://doi.org/10.1212/WNL.0b013e318204a397 [PubMed]
- 37. Caroli A, Prestia A, Galluzzi S, Ferrari C, van der Flier WM, Ossenkoppele R, Van Berckel B, Barkhof F, Teunissen C, Wall AE, Carter SF, Schöll M, Choo IH, et al, and Alzheimer’s Disease Neuroimaging Initiative. Mild cognitive impairment with suspected nonamyloid pathology (SNAP): prediction of progression. Neurology. 2015; 84:508–15. https://doi.org/10.1212/WNL.0000000000001209 [PubMed]
- 38. Jack CR
Jr , Shiung MM, Gunter JL, O’Brien PC, Weigand SD, Knopman DS, Boeve BF, Ivnik RJ, Smith GE, Cha RH, Tangalos EG, Petersen RC. Comparison of different MRI brain atrophy rate measures with clinical disease progression in AD. Neurology. 2004; 62:591–600. https://doi.org/10.1212/01.WNL.0000110315.26026.EF [PubMed] - 39. Morris JC. The Clinical Dementia Rating (CDR): current version and scoring rules. Neurology. 1993; 43:2412–14. https://doi.org/10.1212/WNL.43.11.2412-a [PubMed]
- 40. Rosen WG, Mohs RC, Davis KL. A new rating scale for Alzheimer’s disease. Am J Psychiatry. 1984; 141:1356–64. https://doi.org/10.1176/ajp.141.11.1356 [PubMed]
- 41. Cockrell JR, Folstein MF. Mini-Mental State Examination (MMSE). Psychopharmacol Bull. 1988; 24:689–92. [PubMed]
- 42. Mosconi L, Mistur R, Switalski R, Tsui WH, Glodzik L, Li Y, Pirraglia E, De Santi S, Reisberg B, Wisniewski T, de Leon MJ. FDG-PET changes in brain glucose metabolism from normal cognition to pathologically verified Alzheimer’s disease. Eur J Nucl Med Mol Imaging. 2009; 36:811–22. https://doi.org/10.1007/s00259-008-1039-z [PubMed]
- 43. Jagust WJ, Bandy D, Chen K, Foster NL, Landau SM, Mathis CA, Price JC, Reiman EM, Skovronsky D, Koeppe RA, and Alzheimer’s Disease Neuroimaging Initiative. The Alzheimer’s Disease Neuroimaging Initiative positron emission tomography core. Alzheimers Dement. 2010; 6:221–29. https://doi.org/10.1016/j.jalz.2010.03.003 [PubMed]
- 44. Purcell S, Neale B, Todd-Brown K, Thomas L, Ferreira MA, Bender D, Maller J, Sklar P, de Bakker PI, Daly MJ, Sham PC. PLINK: a tool set for whole-genome association and population-based linkage analyses. Am J Hum Genet. 2007; 81:559–75. https://doi.org/10.1086/519795 [PubMed]
- 45. Yang J, Lee SH, Goddard ME, Visscher PM. GCTA: a tool for genome-wide complex trait analysis. Am J Hum Genet. 2011; 88:76–82. https://doi.org/10.1016/j.ajhg.2010.11.011 [PubMed]
- 46. Risch N, Merikangas K. The future of genetic studies of complex human diseases. Science. 1996; 273:1516–17. https://doi.org/10.1126/science.273.5281.1516 [PubMed]
- 47. Turner SD. qqman: an R package for visualizing GWAS results using Q-Q and Manhattan plots. bioRxiv 2014. Available at: http://biorxiv.org/content/early/2014/05/14/005165. Accessed July 1, 2016.
- 48. Pruim RJ, Welch RP, Sanna S, Teslovich TM, Chines PS, Gliedt TP, Boehnke M, Abecasis GR, Willer CJ. LocusZoom: regional visualization of genome-wide association scan results. Bioinformatics. 2010; 26:2336–37. https://doi.org/10.1093/bioinformatics/btq419 [PubMed]
- 49. Josephs KA, Dickson DW, Tosakulwong N, Weigand SD, Murray ME, Petrucelli L, Liesinger AM, Senjem ML, Spychalla AJ, Knopman DS, Parisi JE, Petersen RC, Jack CR
Jr , Whitwell JL. Rates of hippocampal atrophy and presence of post-mortem TDP-43 in patients with Alzheimer’s disease: a longitudinal retrospective study. Lancet Neurol. 2017; 16:917–24. https://doi.org/10.1016/S1474-4422(17)30284-3 [PubMed]