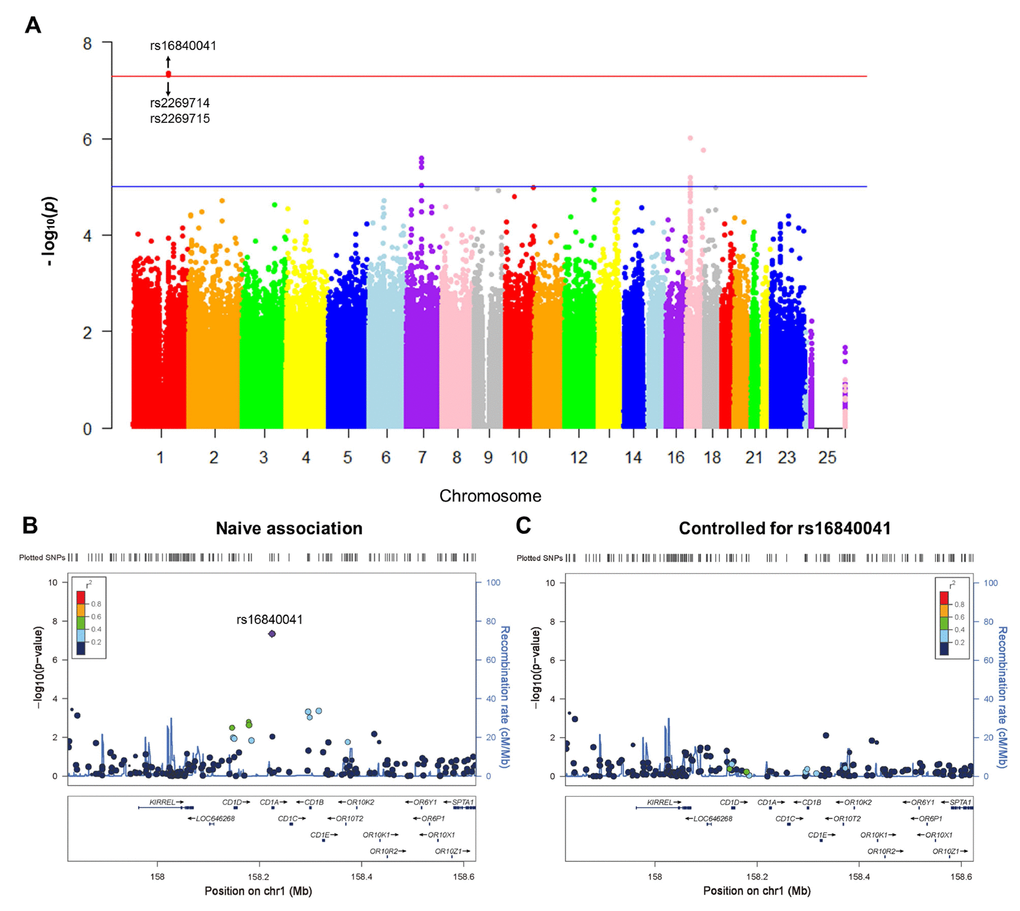
Figure 1.Genome-wide signal intensity (Manhattan) plots showing the -log10 (p value) for individual single nucleotide polymorphisms (A). Regional association results for the 158 Mb to 158.6 Mb region of chromosome 1 (B). Association results for 158 Mb to 158.6 Mb region of chromosome 1 controlling for rs16840041 (C).