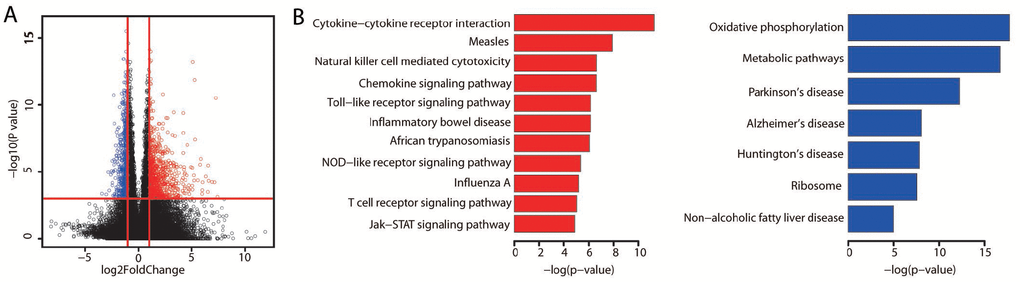
Figure 2.Differentially expressed genes between the better and poorer prognostic groups. (A) The significance of gene expression differences between the better and poorer prognostic groups. Each dot represents one gene. The x axis displays the gene expression difference as a log2-transformed fold-change. The y axis displays the significance as a -log10-transformed P value. The red vertical lines represent log2FoldChange values of -1 and 1, respectively. The horizontal red line represents a P value of 0.001. Genes were defined as differentially expressed if their absolute log2FoldChange values were greater than 1 and their P values were less than 0.001. A red dot indicates high expression, while a blue dot indicates low expression. (B) Bar plots display the significantly (adjusted P value < 0.01) enriched KEGG pathways for the upregulated (red) and downregulated (blue) genes identified by WebGestalt analysis. P values were adjusted by the method of Benjamini and Hochberg.