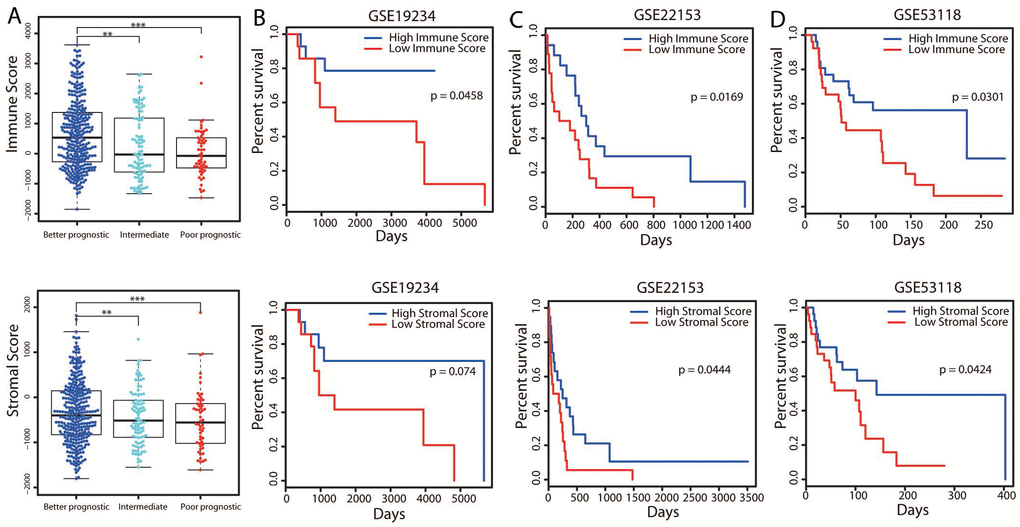
Figure 3.Associations of immune and stromal scores with patients’ OS. (A) The distribution of immune scores (top panel) and stromal scores (bottom panel) in the three groups. The boxplot displays that the immune/stromal scores were significantly higher in the better prognostic group and lower in the poorer prognostic group. **P < 0.01; ***P < 0.001. (B–D) Three independent cohorts of melanoma patients from GEO were separately divided into two groups (the top and bottom tertiles) based on their immune (top panel) and stromal (bottom panel) scores. Kaplan-Meier OS curves are shown for each dataset.