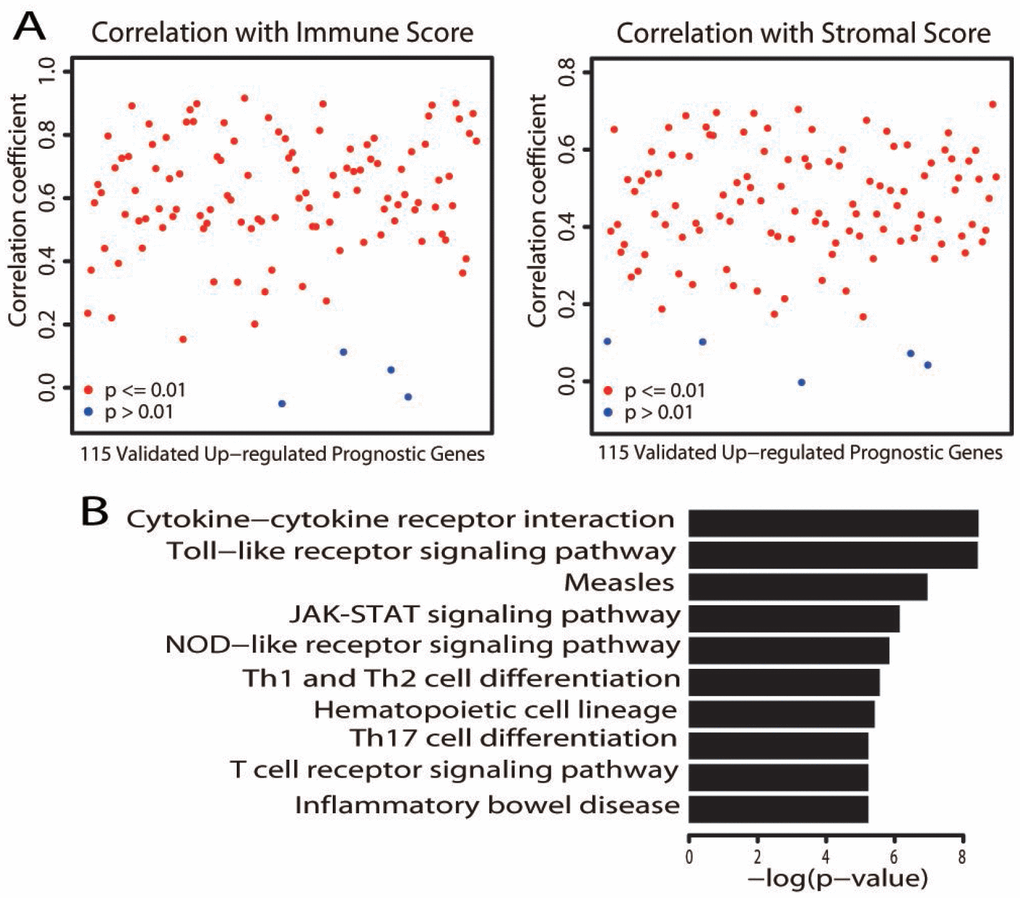
Figure 4.Characterization of the validated upregulated prognostic genes. (A) Correlation of the expression of the 115 validated upregulated prognostic genes with immune scores (left) and stromal scores (right). Each dot represents one gene. The y axis displays the correlation coefficient. Gene expression was deemed to correlate significantly with the immune/stromal score if the P value was less than 0.01 (red dot; a blue dot indicates P > 0.01). (B) Bar plots depict the significantly (adjusted P value < 0.01) enriched KEGG pathways.